India IPO Calendar

There are several IPOs and FPOs planned in the next few months by the government, and I thought I’d create an IPO calendar post to keep a track of what’s going on in this space.

This simple table contains all the companies that the government has proposed to do an IPO or FPO for, and also some details about their listing, pricing etc. The row in green is simply the one that I want to draw attention to either because it got recently listed or is about to open up for subscription.

If a particular detail is missing then that either means that it has not been published yet, or the post is out of date. I will try to keep adding details to these and keep the post updated, but if you see something that you think is outdated please leave a comment and help me out.

Name of the Issue Opening Date Closing Date Price Issued Listing Date Listing Price Listing Gains / Loss
Manganese ORE (India) Ltd. (MOIL) November 26th 2010 1st December 2010 375 December 15 2010
Shipping Corporation of India Limited November 30 2010 December 3 2010 140
SAIL
Engineers India Limited
Hindustan Copper Limited December 6th 2010 December 9th 2010
Punjab and Sind Bank December 13 2010 December 16 2010
ONGC Likely between Jan and March 2011
Indian Oil Corporation (IOC) Likely between Jan and March 2011
Coal India Limited 18th October 2010 22nd October 2010 245 November 4 2010 342.6 39.8%
Power Grid Corporation of India Limited 9thNovember 2010 12thNovember 2010 90 November 25 2010 96.55 7.27%

Please let me know if you see anything missing or wrong.

How do the issuers calculate yield for tax saving bonds?

Last week I took the L&T bond issue as an example to show how bond yields are calculated, and I thought I’d do a biggest post now to detail out some of the things said there so here goes.

There are a couple of tax saving bond recently issued by IDFC and L&T, so this is a good time to look at how the yield for these bonds are calculated, and some tools that will help you do so.

As you must have noticed the bond yields change with different plans, and I’m going to look at the IDFC issue with calculations to show how the yield on tax saving bonds are calculated.

Let me paste the details from the IDFC bonds here for quick reference because we will be using that as an example.

Investment Amount Tax Slab Series 1 Yield Series 2 Yield Series 3 Yield Series 4 Yield
5,000 30.9% 13.89 12.06 17.19 15.74
5,000 20.6% 11.57 10.52 13.41 12.57
5,000 10.30% 9.64 9.18 10.23 9.86
Rate of Interest ———– 8.00% p.a. N.A. 7.50% p.a. N.A.
Buyback Amount ———– 5,000 10,800 5,000 7,180
Time in years ———– 10 10 5 5

Let’s look at a couple of concepts before we deep dive in the process of calculation itself. These concepts are:

Effective Purchase price of a tax saving bond depends on your tax bracket

All bonds have a face value at which you will buy the bond and that is your cash outflow, however that’s not your effective purchase price in the case of tax saving infrastructure bonds. This is because these bonds reduce your taxable income, thereby reducing your tax outflow, and your effective purchase price is the face value of the bond minus the tax it saved you.

Effective Purchase Price = Face value of the bond – Tax saved by its purchase

Let’s look at this taking the IDFC bond as an example:

Face Value 5,000 5,000 5,000
Tax Bracket 10.30% 20.60% 30.90%
Tax Saved on Face Value 515 1,030 1,545
Effective Purchase Price 4,485 3,970 3,455

As you can see your effective purchase price goes down as your tax bracket increases, and this is one of the major reasons their yield table shows a higher yield with a higher tax bracket.

No matter which series you take – your yield will go up as your tax bracket increases because you save more on taxes.

So that explains one part of it, and now let’s look at why yield varies within the same tax bracket.

A lower time period will give you a higher yield

If you remember the IDFC bond issue had series with and without an option of a buy-back. The series with an option of buy-back would have meant that you need to hold these only for 5 years, whereas the other series meant you held on to the bonds for ten years.

The reason the bond yield varies in these two cases is that the absolute tax benefit you get remains the same in both the cases, but in one case it is spread out over only 5 years, whereas in the other case it is spread out over 10 years. The tax you save will be the same whether you invest in the buyback option or not, and since the interest rate is much lesser than the tax savings – a longer time period lowers the yield.

So in this case if you compare Series 1 and 3 or Series 2 and 4 – everything is the same except the buyback period and that’s causing the difference in yield.

How to calculate bond yield when no interests are paid?

These series differ by two factors – buyback option, and payment of interest.

We looked at the buyback option and how it affects bond yield earlier, and now let’s look at payment of interest. One series pays out interest annually, whereas the other series doesn’t pay out any interest annually, but rather pays a lump-sum at the end of the time period.

Let’s first look at the yield for the series that pays a lump-sum.

You already know what your effective purchase price is, and you also know what you will get at the end of the time period, so all you need to do is to plug in these numbers in the Compounded Annual Growth Rate (CAGR) Calculator and see what the yield is.

Conceptually you are saying that if I start out with Rs. 3,455 (30.9% tax rate) then what is the rate of interest at which I should invest this sum, and also the interest earned every year, so that I reach at the amount at the end – Rs. 7,180 (series 4 example).

Here is how that table looks like.

Investment Amount Tax Slab Effective Purchase Price Series 2 Yield

(CAGR)

Series 4 Yield

(CAGR)

5,000 30.9% 3,455 12.06 15.74
5,000 20.6% 3,970 10.52 12.57
5,000 10.30% 4,485 9.18 9.86
Buyback Amount ———– ——- 10,800 7,180
Time in years ———– ——- 10 5

The post about CAGR also details how it is calculated, so you can read more there.

In future to calculate any bond yield where there are no annual interest payments look for these elements:

  • Face Value
  • Tax Bracket
  • Effective purchase price
  • Time in years
  • Buyback amount

Then use effective purchase rate, time and buyback amount in the CAGR calculator to find out the yield.

How to calculate bond yield when interest is paid yearly?

When the interest is paid out yearly – you need to use a formula called Yield To Maturity (YTM) and calculate the bond’s yield. There is a nice little calculator present on this site that you can use to see how this works out. Use Series 1 and 3 and you will get a table such as the one below.

Investment Amount Tax Slab Effective Purchase Price Series 1 Yield

(YTM)

Series 3 Yield

(YTM)

5,000 30.9% 3,455 13.89 17.19
5,000 20.6% 3,970 11.57 13.41
5,000 10.30% 4,485 9.64 10.23
Buyback Amount ———– ——- 5,000 5,000
Time in years ———– ——- 10 5
Coupon Rate 8.00% 7.50%

If you input 3,455 in Current Market Price, 5,000 in Par Value, 8.00% in coupon rate, and 10 years – you will get your yield.

This formula assumes that whatever interest payments you received were re-invested at the coupon rate, and then takes the market value of the bond to calculate your yield.

In our example, this formula will say that you invested Rs. 3,455 initially, then get Rs. 400 at the end of every year which you will continue to re-invest at 8% and reap the benefit of compounding. Now this is an assumption so if you don’t actually end up investing your interest payment every year your yield will be reduced.

Factors not looked at while calculating yield on tax saving bonds

One obvious factor is the yield doesn’t take into account the taxes that you will end up paying on interest received. Other factor is that this formula doesn’t take into account any transaction costs that you incur.

I have another post lined up next week which looks at the limitations of the way these yields are being calculated in which I will cover some things that are not part of the way the yields are calculated by the issuer.

Conclusion

When you see a yield on a table – you might say higher is better, but then you need to keep in mind that in some cases to get the highest yield you will have to re-invest the interest payment yourself also.

Then there is the issue of time period also, would you much rather have your money back in 5 years or you are fine with keeping the money invested for 10 years since it is a relatively small amount.

Then of course, if you pay tax on that interest your yield goes down automatically by the amount of your tax paid.

I covered a fairly big area here, so if you feel that I got something incorrect, or something could be explained better please feel free to leave a comment, and I’ll try to answer it, or correct it as the case may be.

Weekend links October 29th 2010

Let’s start off this week by an article about insider trading in the Dealbook. This case is not against the promoters, directors or any other senior executives, but rather on a mechanical engineer and a trainman of a railroad company!

From the Dealbook:

Late last month, the Securities and Exchange Commission brought an unusual and colorful insider-trading case: It accused two employees who worked in the rail yard of Florida East Coast Industries and their relatives of making more than $1 million by trading on inside information about the takeover of the company.

How did these employees — a mechanical engineer and a trainman — know their company was on the block?

Well, they were very observant.

They noticed “there were an unusual number of daytime tours” of the rail yard, the S.E.C. said in its complaint, with “people dressed in business attire.”

This looks more like a case of putting 2 and 2 together by these people and making some bets, and not insider trading to me but unfortunately for these two guys my opinion doesn’t count. What do you make of it?

Earlier this week I wrote about volatility and Roger Nusbaum has a very thoughtful post on the difference between risk and volatility. I really liked the post, and recommend it strongly.

Another thoughtful post – this time by Sandip Sabharwal on what long term equity markets should average.

Frank from Bad Money Advice has this great post about gift cards in which he talks about how some gift cards actually sell at a premium, and also how the treasury is worried about terrorists getting their hands on gift cards!

The Digerati Life has this useful post about how you can do stock market research.

Let me end with this post by Deepak Shenoy where he answers some questions from a reader about credit card overcharges.

Enjoy your weekend!

Your salary will increase with inflation too

I got this email early last week (slightly edited):

I would like to know something about annuity. I am 49 yrs old, suppose I am investing Rs. 100,000 yearly till i attain 60 years and NPS is showing growth in total of 1600000.
40% will be 6,40,000.
Now explain to me how annuity of 6,40,000 will help me for rest of my life?/for how long?/how much?
I am still confuse about retirement plan.
If I calculate inflation and I retired at the age of 60 yrs and live up to 75 years. What so ever I save for my retirement plan appears to be peanuts.
Thinking daily on “life after retirement” a am spoiling my today.
If you have some better idea about retirement please guide me.

To me the heart of the problem is the sum that this person expects to accumulate when he is 60, and not the annuity itself because if you can accumulate a decent sum at the time of retirement, then you can do an annuity, fixed deposit, plan your withdrawal rate, whatever, but if you don’t have a lot at that age, then what is the point of thinking about anything else?
In that sense, I think this is slightly different from the earlier discussions we’ve had on this topic here.

In an economy like India where the inflation rate is quite high it is only reasonable to be worried about how inflation will eat into your retirement nest, however the other side of the coin is rarely talked about, if ever at all.

Your salary should also increase to match inflation and you should at least be able to increase your savings by the inflation rate or even if it is a smaller number, there should be some increase right? But this is too often not accounted for even when it’s quite clear that it can be quite a big number.

Let me give you an example: If you invest Rs. 1,00,000 per year for 12 years, and get 8% per annum returns on your investment, at the end of the 12 years you will have a corpus of Rs. 18,97,712, but if you increase your investment by 8% every year by age 60 you will accumulate about Rs. 25 lakhs, and one more year will make this sum go to Rs. 30 lakhs.

I’ve done these calculations here so you can see how I reached that number.

The key is not to be despondent, and start doing the right thing – better late than never right?

Micromax IPO Review

Micromax recently filed its prospectus, and will be coming out with an IPO very soon. One of the first things that caught my eye about this IPO is that they’re thinking about giving a 10% discount to retail investors instead of the customary 5%. I thought I’d take a look at the Micromax IPO prospectus even though the dates or pricing is not yet out, as I was interested to see how this relatively new player has performed in the highly competitive telecom market.

About Micromax

Micromax is the biggest Indian domestic mobile handsets company and has been growing explosively in the fast growing telecom market since they started in January 2008, and their market share stood at 6.24% for the March 2010 quarter. Micromax has been more about affordable handsets which shows in their average selling price of Rs. 2,275.98 for the March 2010 quarter.

They have over 30 handset models selling in the Indian market, and that helps in not relying on just one product to drive revenues, as no single handset accounted for more than 20% of their revenues. Similarly, they are well diversified across states, and no single state accounted for more than 10% of their sales.  They are currently not present in Android or Touch phone segments, but plan to produce phones for these segments in the future.

The growth in Indian telecom has been really explosive in the past few years, so it is natural to ask how long will it continue at the current pace, and what happens when a large number of people own mobile phones?

The replacement market has got to be the key going forward with people switching or upgrading their handsets, and I found some interesting numbers on this market from the Micromax IPO draft prospectus.

They quote research from Analysys Mason which states that the replacement market will drive the market rather than new additions. Even currently, the replacement market constitutes as high as 62.77% of the total handset market for 2010, and they expect this percentage to grow to 89.30% of total handset market by December 31st 2014. In absolute numbers – from 118 million handsets in 2010 to 359 million handsets in 2014.

They are also looking at adding some subscription based value added services, and here are a few of them mentioned in their prospectus.

Receive email on SMS: They are developing an application that would allow customers to receive emails on SMS, targeting mobile subscribers who do not have access to GPRS services or data connectivity.

Phonebook backup: They are developing a ‘phonebook backup’ application, where customers can store their contacts backup, and pull them up later when they need it.

Buddy Tracker: This is a Foursquare like application which has already been developed but not launched yet. This application will allow Micromax subscribers to track the location of friends and contacts also using Micromax using paid SMS service.

Facebook agreement: They have also entered into an agreement with Facebook to be able to use their brand features within the applications that Micromax develops.

The biggest risk to Micromax is that it is in a highly competitive market where there exist much larger players like Nokia, Samsung, LG, and Videocon. These players have much bigger resources at their disposal and pose a competitive threat to Micromax.

There are several VC firms invested in Micromax as well, and here are their details:

US Private Equity Firm Stakes in Micromax

Private Equity Firm Pre IPO Stake
TA Associates 15.00%
Sequoia, Sandstone and Madison 5.77%
http://bit.ly/9hamfX

Micromax IPO Financials

The first thing that struck me about the balance sheet is that there is hardly any debt on its books. The size of the balance sheet is Rs. 5.39 billion in 2010, and the total of the secured and unsecured loans was just Rs. 11.69 million. This is probably due to the fact that they don’t have any manufacturing facility thereby not incurring much capital costs.

Their revenues have significantly grown in the past few years and stand at Rs. 16,017.58 million for 2010 with a net profit after tax of Rs. 2,003.16 million.

The EPS for 2010 is Rs. 11.83 up from Rs. 1.41 in 2009, and Rs. 0.89 in 2008. The company had a negative cash flow in 2008, but it has been generating positive cash flows after that.

Objective of the Micromax IPO

Micromax currently doesn’t have a manufacturing facility, and it intends to change this. Currently they design their products internally and then contract with manufacturers to manufacture and supply them. They suppliers are primarily located in China and Taiwan.

They want to change this by setting up their own manufacturing facility, and the money raised by the IPO will be used for this. They are looking at big numbers too – the plan is to spend Rs. 2.26 billion on setting up factories that will have the capability to produce 2 million handsets per month.

I will update this post with more information about pricing, and dates as and when they are released, and for now I wanted to get a glimpse of what the company has done in the past, what is the money being raised for, future plans etc.

Limitations of the way yields are calculated for tax saving bonds

I’ve done a post about calculating yields on tax saving bonds, and on that post I focused on the mechanics of the yield calculation but that’s really the first step of the ladder.

You have to first understand how a yield is calculated in order to judge whether that’s the right way of calculating yields or not, and what are the limitations of it. I had this post originally scheduled for next week, but an email exchange with reader Amit Shah prompted me to post this earlier as that made more sense.

So, now that we are past the step of understanding how bond yields for tax saving infrastructure bonds are calculated let’s take a look at some more factors about these calculations.

1. They don’t take into account tax paid on interest: The way yields are calculated for the series that pays annual interest don’t take into account the taxes that you will pay on the interest received. This is just the way this calculation is done, and if you are comparing it with another instrument that you can invest in and won’t have to pay taxes on (like PPF) you should include taxes on interest in your calculation. However, if the instrument you are comparing these with also require you to pay tax then it may not make so much of a difference.

2. They don’t take into account capital gains on cumulative options: The cumulative option on these bonds mean that you will get a bond with a much bigger value at redemption compared with the face value. This will attract capital gains, but those are also not part of the calculation. Frankly, at this point I don’t know how those taxes come into play but these calculations are mute on them.

3. Yield on the shorter duration is calculated considering buyback has been exercised: The infrastructure bonds have come out with buyback options from the issuers where the issuer has the option to buy them back after say 5 or 7 years. This is a call option from the issuer which means that they may not exercise it, and you end up holding your bonds either till maturity or have to sell them on the exchange. The yields have been highest on the buyback options, so if they don’t exercise the buyback then the yield will reduce.

4. Yield to Maturity (YTM) assumes that you can re-invest the interest earnings at the same rate of interest: The YTM calculations are used to calculated yields on the series where the interest is paid out annually, and this assumes that the interest you earn will be invested by you in a security that earns the same rate of interest throughout the remaining period of the bond. This may not happen if you lose some part of the interest in taxes, or aren’t able to find another security that pays the same rate of interest as the original one.

5. They don’t take into account on bond listing: These bonds will list after an initial lock in period, and if the interest rates are higher at that time, then these bonds should list at a discount. In case that happens, and the issuer doesn’t exercise the buyback then you will either have to wait for the full term of the bond, or sell at a discount which will also reduce your yield.

Conclusion

It’s a good thing to be aware of yields because you obviously need them to compare with other products, but keeping these points in mind is a good reminder that the yield number is not cast in stone, and depends on a few other variables as well, and if some of these factors change then your yield will change as well.

Reader Email: Miteysh Shah’s broad investment strategies

Reader Miteysh H Shah sent me his story about how he developed his investing approach and I was deeply impressed with the depth of the products he covered, and the sincerity with which he took responsibility of his mistakes and decided to do his own research, learn from his mistakes and develop a strategy.

While you may or may not agree with his take on individual assets I am sure you’ll agree that all of us can learn from his amazing attitude of deciding to take it upon himself to learn about his finances better and come up with an approach that works for him.

Hats off to him for doing that, and here are his thoughts.

Dear Manshu,

My 1st investment in market was ULIP product bought on 8th Dec 2007; before that I was zero about the markets I was thinking it was just gambling because I heard many stories from people that they lost everything in that.

When I decided to enter I was searching a proper advisor but I didn’t know where I could find a decent advisor and I just ended up meeting salesmen who were more interested in commissions rather than showing me options and the right way to enter the markets. At last when I found the right person but was late because the markets had began their downwards march and even I had bought a few products not right for me.

By the time market started upwards in march 2009 – I had tried almost every product available & ways to recover my heavy losses because my family was already against it.

The most important thing I learned is that we have to take care of our own money nobody on earth is interested in the growth of your money, he is just interested until his interest is done.

So from March 2009, I started my research instead of blindly believing to false promises of salesmen in this case if I lose only I will be responsible for that & I will learn from my research.

Now when I’m losing I know where I’m wrong & I can correct that in my next opportunity, but in the salesmen or PMS case you just handover yourself completely to them.

Let me now go on to state my various assets now.

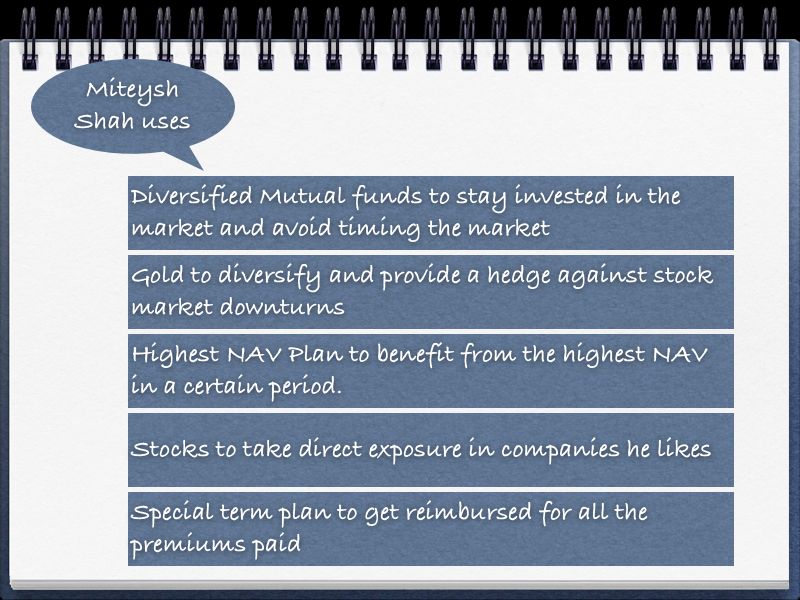
Diversified Mutual funds

Always stay invested in 3-4 good diversified mutual funds through SIP, as we can never time the market. Get an appropriate mixture of large-cap, midcap, small-cap & balanced mutual funds based on your risk – appetite.

Gold

As per 1 of your past articles on gold & its moving 10 years chart – I see that gold is also a good hedging fund, so we can keep buying a few units of GOLD ETFs regularly.

I have also noted that whenever market moves downwards – gold begins its upward journey, so this can be 1 advantage of it. You can regularly invest like this by opting for your broker’s facility of auto transfer to create a SIP for your gold ETF purchase.

Highest NAV Plan

Although I don’t expect a highest NAV return plan to match a good mutual fund return I’ve still invested a part of my portfolio in it to gain some benefit of this product, which gives the benefit of the highest market level traded in the specified period.

In this I like Birla platinum ULIP plan because they provide highest NAV returns based on all the trading days in a year so you can’t miss any of the highest level on any day like in others as I know highest NAV is provided only on few dates in a month but what if the markets hits all time high on a non-record date of plan?

Reliance Super Automatic Investment Plan

I like Reliance Super Automatic Investment plan because of its advantage of 52 free switches in many of the funds available in the plan like equity fund, infra fund, energy fund, gilt, midcap, money market.

We can switch the funds as per the market movements; can book profit in down turn & reinvesting in equity at lower levels. This is a free service without any cost that too we can do online at our convenience. Also you can opt for single premium.

This fund is good to gain in such a volatile markets where in 1 day it can swing up to 500~600 points & down up to 400 points, we can take advantage of both the sides of market without getting nervous in -ve or +ve

Stocks

I have my own watch-list of stocks based on research & studies I have done myself and I have rated them myself as well. I keep accumulating the good ones at every dip but you have to be very much updated in primary equity before every buy or sell.

To select the right stocks from the various scripts, I think the right way is to think yourself what business you like to enter, what business you would invest if you have a chance… my meaning is investing in stock – take it as your own business – not just for trading then you will enjoy the earnings & you will automatically have that confidence on that scrips rather than listening on TV shows.

One more thing I would like to add here is when we feel the market is at peak & fear of down turn we can start booking profit by moving our money to balanced fund & in raising market start shifting to equity. Balanced because we cannot judge the bottom & peak point & also somewhere we believe in the India growth story.

MIP

Youngsters can use MIP which is available with 10~20% equity to gain markets exposure on +ve side. However MIP has exit load for 6~12 months in that case we can select STP to save entry/exit loads wherein you can switch to the all types of funds available with same AMC- Equity diversified, balanced, liquid, MIP, etc. for investors who don’t want to take risk at all can go with various liquid funds with no equity portion.

Now-a-days MIP is also available with debt+equity+gold such as Religare MIP plus this way you can cover all sides of safety instruments.

Insurance

For insurance we can go for special term plan wherein we get reimbursement of all the paid premiums & can fix our premium till the age we have opted for.

In fact technically if we do the math normal term plan is cheaper than special term plan considering the balance premium to be invested in MIP or debt or equity because the reimbursed amount we will get at the end of special term plan is without interest.

So overall as per my views we can be rest assured of any movement in the market. We can take every fall or rise as an opportunity to gain. This is better way to do it ourselves rather than giving our money blindly & to follow-up even though paying him the fees & charges. In all this product you don’t need to sit in front of the TV or markets you can just do it at your convenience.

There you have it, this is my approach – please leave a comment to let me know what you think!

Investing for beginners – Dealing with Stock Market Volatility

This post is next in my investing for beginners series (earlier posts include asset allocation, diversification, things to do before you start investing), and for this post I wanted to talk about volatility and dealing with it.

State Bank of India (SBI) is one of the bluer blue chips in India, and a look at its 52 week high / low on BSE reveals that the 52 week low was Rs. 1,863 and 52 week high was Rs. 3,222.

So, what happened in the last year to warrant this? Why did the stock price move up about 70% from 1,863 to the 3,200 it is today?

Did SBI fundamentals change so dramatically that they triggered a 70% jump? Just what exactly did it do to jump that much in a year?

Let’s go back in time to about 2 years ago when the world was falling off a cliff, and see what happened to the price of the SBI stock then.

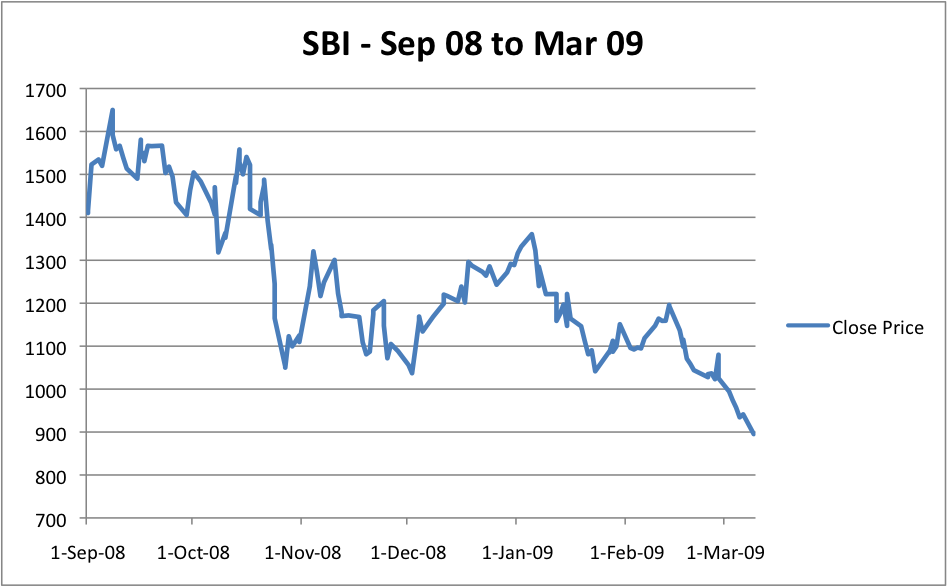
SBI was Rs. 1,650 on September 8 2008 from where it dropped to Rs. 895 on 09 March 2009. In a six month period the stock dropped about 45%!

SBI Sep 08 to Mar 09

The steep drop from 1,650 to 900 or so makes you wonder if a bonus was declared, but I couldn’t find one. But even if SBI is a blue chip, it’s still a stock, so let’s take a look at an Index itself to see if that’s volatile too.

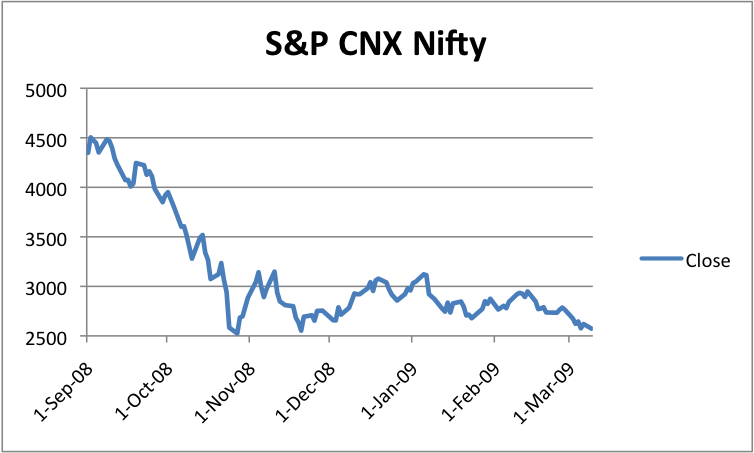
What about the Nifty? How did it perform in the same time period?

CNX Nifty Sep 08 - Mar 09

From 4,500 it dived to 2500 in a matter of weeks!

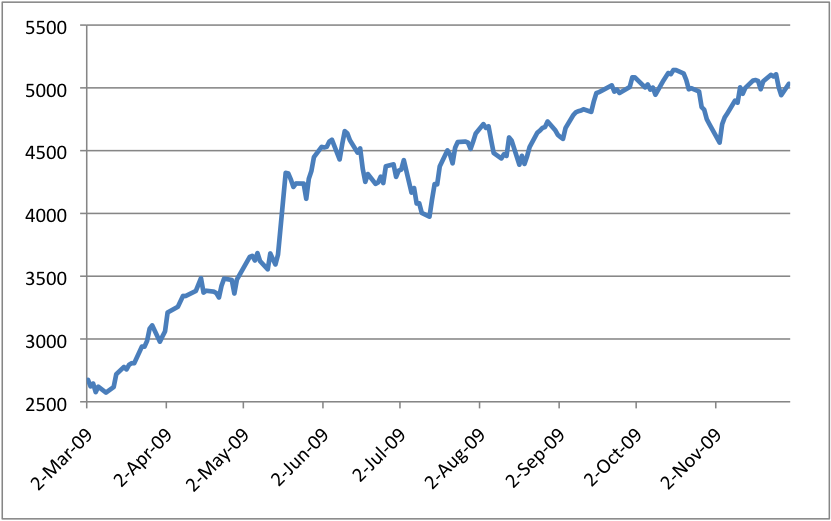
So, what do you think happened in the next six months?

Nifty doubles in value in 6 months
Nifty doubles!

Whoa!

These might seem like crazy moves to you, but they are still better than most because I took a look at a huge stock and an index itself, which are much less volatile than the rest of the market. During the real estate crash or the IT bubble burst – there were several stocks that lost much more than 50% of their value in a much shorter time – frame.

If you’re thinking that this crash was because I’ve taken a time period which saw us having a really bad recession, a quick look through news archives will show you that we’re habitually thinking that the end is near, and crashes are part of life.

You can go take the yearly highs or lows of any stock from an old paper and you will see that there is big gap between the two prices, but there aren’t that many fundamental changes with the company in question. SBI didn’t shut down half of their branches to see the stock plunge that much – that’s the nature of the stock markets.

So, given all this – how do you deal with the volatility in the stock market?

Do you stay completely away from the stock market?

One obvious answer is just stay away from stock markets, and focus on other investments that are not so volatile and which don’t expose you to such huge swings. You could do that, and you should certainly have some allocation towards safer assets but if you stay completely away from the stock market you won’t even be able to beat inflation that runs high in India. So you can diversify in other assets, but for most young people staying away from the market is probably not a practical option.

Do you try to time the market?

All you have to do is buy low and sell high right? That sounds simple enough, but when do you know the market has over-heated or when do you know the bottom has been reached? Timing the market is impossible – no one knows how the market will behave in the short run so you can’t really go all in at one shot or sell everything at another. In fact in October 2008 I wrote a post about not trying to catch falling knives, and how I was gradually accumulating stock even though they were dropping, so while over a period of time it is possible to accumulate stock at lower prices  – if you go all in, and the market falls more then you are stuck with it.

Timing doesn’t work for most, so it very likely won’t work for you also, and while increasing your stock purchases when the market crashes and booking profits when the market is at highs might help – if you just decide to catch every top and bottom – that won’t work at all.

Understand that volatility is an inherent part of the market and be ready for it

If you haven’t seen a market crash yet, then brace for it – no one knows when it’ll take place but violent downswings and upswings are just part of the market, and if you know they’re coming – you don’t get scared when you are in the middle of it, and end up selling all your stock at yearly lows.

If you have a diversified portfolio and assets other than stocks then you will have a much easier time dealing with volatility because all your eggs are not in one basket. Sure you stand to lose money, but at the same time some part of your investment is secure and that will give you comfort.

At times such as these don’t let panic set in, but instead continue your SIPs or think about investing in some large blue chip stocks.

Look at it this way – a company like Tata Steel has been around for more than 100 years, and it’s seen a lot more ups and downs than you have, so although there are chances that it may go to zero (remember Lehman?) they are not as high as they would be with a smaller company.

Think about State Bank of India – if SBI goes to 0 then you have much bigger things to worry about than your stock.

It’s really hard to think that the world is not going to end when everyone else around you says that it will. In such times it is really difficult to keep the faith, but if you are well diversified, have bought companies with good fundamentals, and are in it for the long run – you will find the going much easier.

Volatility is part and parcel of the market and the sooner you learn to deal with it the better it is.

Power Grid FPO to open on November 9th

If you were feeling a void in your life because the excitement surrounding the Coal Inda IPO is dying down gradually – I have good news for you. The Power Grid Follow on Public Offer (FPO) is going to commence on the 9th November and will close on the 12th November for retail investors, while it will close a day earlier for Qualified Institutional Bidders (QIB).

I will do a full review on Power Grid a little later when I get my hands on the prospectus, but for this post I wanted to see how the Power Grid IPO performed, and how it’s stock moved after listing.

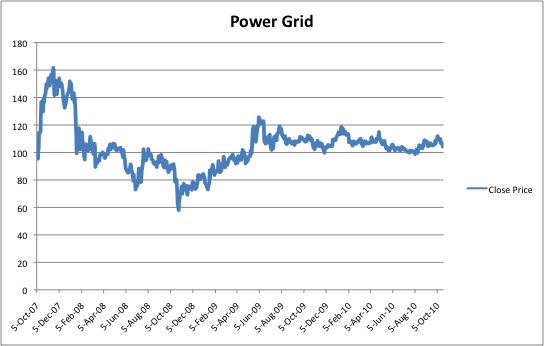
A quick search through news archives reveal that Power Grid scorched on listing in 2007. The IPO was priced for Rs. 52 and ended the first day with a gain of 93%. The first day also accounted for 21% of the combined turnover of the NSE and BSE.

Power Grid Stock Price since IPO

The move since then hasn’t been that spectacular and shows that the people who bought it post listing didn’t get that good a deal. Before you jump to any conclusions about investing in the IPO based on this chart remind yourself in a high pitched fast paced ridiculous voice that past performance is not an indicator of future returns.

Enjoy your Sunday!

Click here to read about some key Power Grid FPO Numbers

Off topic links this week

This week I discovered Mark Suster’s blog via Fred Wilson, and it is simply one of the best blogs I’ve discovered in a while.

Mark Suster is a venture capitalist, so a lot of you may think this is not relevant to you, but I strongly suggest you give it a try because ultimately what Mark and Fred talk about can also be used by professionals working in companies, and you don’t have to be an entrepreneur to benefit from their knowledge.

Both these VCs are great bloggers, and there is a lot to learn from them, so I suggest you subscribe to their blogs, and give it a try.

I had never heard about Chamillionaire before, and I will probably never listen to his music because I’m not interested in rap at all, but I have spent the past hour watching his interview with Mark Suster, and this guy is pure genius. The video is slightly longish at an hour and 10 minutes, but it is full of insights on how this rapper grew his brand, and it’s really quite amazing.

Since we are away from investing related topics, let me share three food blogs that I follow and find really useful.

I discovered Show me the Curry a few months ago, and this is a really great food blog for any of you wanting to learn to make Indian dishes.

Manjula ji’s blog is another great place to learn Indian dishes, and if you wanted a little variety then I’ve found the Easy French Food blog to be a good place for relatively easy French recipes.

Since we are on the subject of cooking let me share this post from The Digerati Life about baking cookies and sharing them in a cookie exchange, which is a refreshingly different topic from the usual personal finance stuff on her site.

Okay, so I spoke about VCs, rappers, food blogs, cookies – am I forgetting something? Oh yeah – I forgot to tell you about the great ideas to make your home look prettier we get from the Freshome site, which is a great website with plenty of interior decoration ideas.

Now, I am done – enjoy your weekend!