I came across India’s per capita income figures the other day, and it makes a very interesting read. The per capita income for India for 2010 is Rs. 54,835 which grew from Rs. 46,492 the year before.
The first thing that strikes you about this number is how low this number is – by aggregate GDP India stands number 9 or 10 in the world, but if you take the per capita GDP then India is a lowly 138 by IMF estimates, and 109 by World Bank estimates. CIA estimates rate it at an even lower 142.
In fact, if you look at the state with the lowest GDP – Bihar at Rs. 20,069 or about $456 – and compare that with other countries then it would come as low as 170 or so.
Bihar is also only about a seventh of Delhi’s GDP, and that reflects the disparity between the various states.
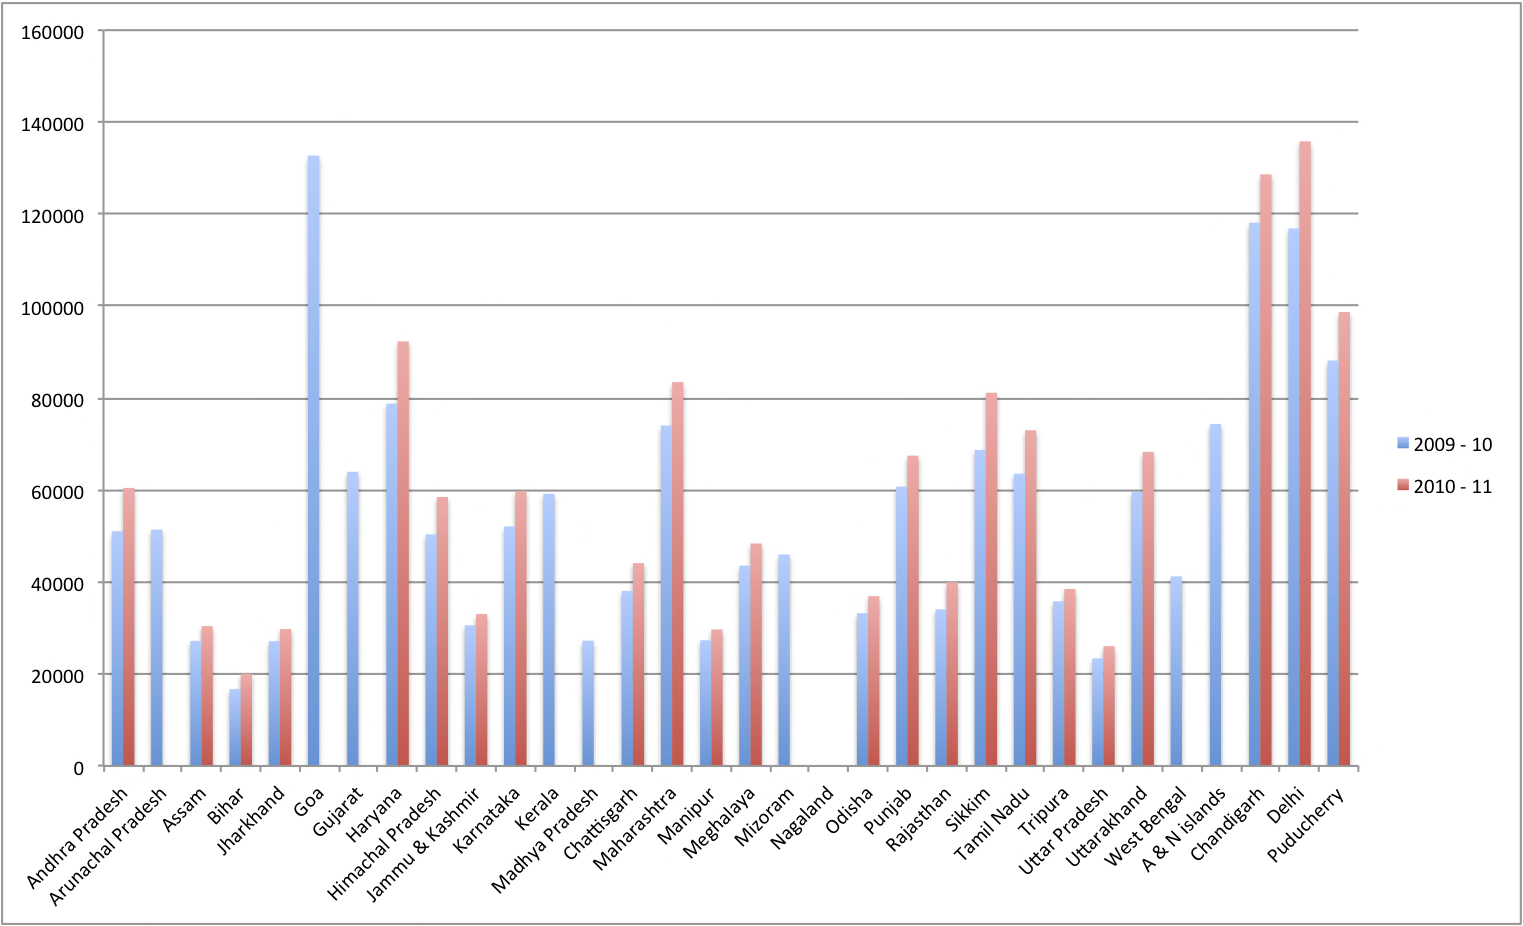
Here is the chart which breaks down the per capita income by state for 2009 and 2010. Wherever values are zero, it means that there was no data for that state in that period, and I had to make it zero in order to create the chart. (click to enlarge)

In this chart – Goa is doing well, and I think this is closer to reality than the high unemployment shown in the unemployment survey.
Apart from the low number, and disparity, the third thing that strikes me is the role of cities in the high GDP. The tallest towers belong to cities, and to me, industrialization, building cities, and moving the workforce out of agriculture into more industries, and services seems to be the only way to grow the GDP numbers, and generally improving the standard of living in the country.
A look at the countries with the highest per capita GDP confirms this because there aren’t any countries there that aren’t industrialized.
I’m interested to see what the break up of the GDP for each of these states looks like also. At present, I don’t know if that data is available somewhere but I’ll look for it. If you know about such a document then please do leave a link.
Finally, here is the data for the above chart in a format that you should be able to copy in Excel easily.
| S.No. | State | 2009 – 10 | 2010 – 11 |
| 1 | Andhra Pradesh | 51025 | 60458 |
| 2 | Arunachal Pradesh | 51405 | 0 |
| 3 | Assam | 27197 | 30413 |
| 4 | Bihar | 16715 | 20069 |
| 5 | Jharkhand | 27132 | 29786 |
| 6 | Goa | 132719 | 0 |
| 7 | Gujarat | 63961 | 0 |
| 8 | Haryana | 78781 | 92327 |
| 9 | Himachal Pradesh | 50365 | 58493 |
| 10 | Jammu & Kashmir | 30582 | 33056 |
| 11 | Karnataka | 52097 | 59763 |
| 12 | Kerala | 59179 | 0 |
| 13 | Madhya Pradesh | 27250 | 0 |
| 14 | Chattisgarh | 38059 | 44097 |
| 15 | Maharashtra | 74027 | 83471 |
| 16 | Manipur | 27332 | 29684 |
| 17 | Meghalaya | 43555 | 48383 |
| 18 | Mizoram | 45982 | 0 |
| 19 | Nagaland | 0 | 0 |
| 20 | Odisha | 33226 | 36923 |
| 21 | Punjab | 60746 | 67473 |
| 22 | Rajasthan | 34042 | 39967 |
| 23 | Sikkim | 68731 | 81159 |
| 24 | Tamil Nadu | 63547 | 72993 |
| 25 | Tripura | 35799 | 38493 |
| 26 | Uttar Pradesh | 23395 | 26051 |
| 27 | Uttarakhand | 59584 | 68292 |
| 28 | West Bengal | 41219 | 0 |
| 29 | A & N islands | 74340 | 0 |
| 30 | Chandigarh | 118136 | 128634 |
| 31 | Delhi | 116886 | 135814 |
| 32 | Puducherry | 88158 | 98719 |

I blog often and I truly appreciate your information. This article has really peaked my interest.
I am going to book mark your site and keep
checking for new information about once per week.
I subscribed to your RSS feed too.
hi manshu – check this out – http://chartsbin.com/view/2242 . i went to chartsbin.com and dropped your data. and i got a map. may be you could use it create charts too. or you may be already knowing this. love your blog. sorry for the interruption.
Hi Ravi – This is excellent – I am so glad you shared this here – I had no idea that such a tool existed and now that you have told me about it I will definitely use them. Will also share this on the OneMint Facebook wall.
Thanks a ton!
Nice article. Is there anything to be inferred by comparing the per capita GDP and the per capita income of states? GDP is roughly how much the states produce and income is what money they earn. So, does the difference tell us the overall surplus/deficit of income to the government? Sorry, if it sounds silly..
In this case they are the same. A lot of times you will see Per Capita GDP and Per Capita Income being used interchangeably.
Another interesting read here – http://www.economist.com/content/indian-summary
Thanks Neel – that was a very interesting thing they did there. I’m a bit surprised I didn’t share in my weekend links.
very interesting read..
I read a headline today which said the UP government bans Aarakshan and I thought to myself, yeah that’s your most pressing problem right now. Which movies to ban – good job.
i never comment on politics publicly.. it sucks 🙁
True.