REC 80CCF Infrastructure Bonds

Rural Electrification Corporation (REC) which is a Navratna and has high debt ratings has come with the latest issue of 80CCF infrastructure bonds.

This issue opened on 19th December 2011 and will close on February 10 2012, and has interest rates which are only just slightly lower than the other two issues – IDFC and IFCI that came out recently, though they are higher than the PFC issue.

Here are the four options that you can choose from the REC issue.

Option 1 Option 2 Option 3 Option 4
Face Value Rs. 5,000 Rs. 5,000 Rs. 5,000 Rs. 5,000
Maturity 10 years 10 years 15 years 15 years
Buyback option 5 years 5 years 7 years 7 years
Interest Rate 8.95% 8.95% 9.15% 9.15%
Interest Payment Compounding Annual Compounding Annual


There are going to be questions on which is the best infra bond among the ones that are open right now, and I think all of them are very close, and it’s just not possible for me to say definitively that one is better than the other.

The other question is between annual and compounded options, and if there is a tax benefit of opting for the compounded one because capital gains taxes are lower than tax on tax on interest payment, and the answer to that is it’s not tax efficient because even in the latter option they charge tax on interest and don’t use the capital gains calculation.

Now, you could say that I’d much rather have Rs. 30,308 after 5 years (if you invested 20K in the 5 year buyback option) instead of earning an interest of just Rs. 1,790 in a year and that’s your option but as far as tax is concerned – one is not more efficient than the other.

I don’t know if there are any other infrastructure bonds lined up but there are already quite a few open and  you should pick one soon so that you get the necessary documents for tax purposes in time.


India’s Export Composition in Three Simple Charts

As far as I know – India has never had a trade surplus, which means that it has never exported more than it has imported, and I got curious to see what comprises of the exports of the many East Asian countries that have consistently run trade surpluses for years.

But in order to make any comparison, you need to know what India’s exports constitute of first, and I wasn’t sure of what the numbers looked like, so I went to the RBI website to look at some data.

RBI has the latest provisional foreign trade data for the 2011 April – September six month period, which shows that India’s exports were $160 billion in that time period. It is important to note that this includes only merchandise exports, and doesn’t include Services exports which are also a big foreign exchange earner for India.

I couldn’t locate the six month number that included Services, and had to fall back upon the first quarter April – June 2011 – 12 Balance of Payment data to get the proportion between goods and services.

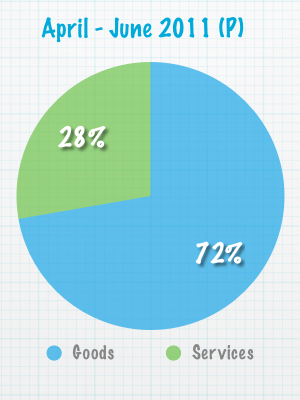
This data shows that the goods exported were worth $80.58 billion, and services exported were worth $30.95 billion.

India Merchandise and Services Exports

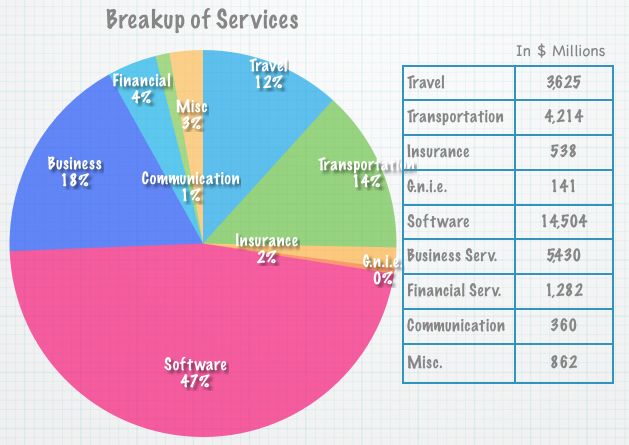
Now, that we see what the split between the goods and services look like, let’s take the smaller piece first, and see what contributes to the Services.

Breakup of Services
Breakup of Services

As expected, software exports dominate services and a large part of the services exports are what we commonly refer to as BPO and IT Enabled Services.

Now, let’s take a look at merchandising, which is the bigger chunk of the exports. Here is a chart that breaks out merchandise.

Breakup of Exports
Breakup of Exports

To make this chart easily readable – I didn’t label some smaller categories – the 4% there is Ores and Minerals, 2% is Others and 1% is Leather and Manufacturers.

The biggest category of exports is engineering exports which must be the kind of thing that a L&T, BHEL or Tata Motors exports, and petroleum products is the second largest exports which is what Reliance Industries exports which also happens to the biggest exporter out of India.

I don’t think I would have been able to guess any of these numbers correctly if I hadn’t looked at the RBI data first, and I’d like to see data for a full year to see whether this quarter represents the whole year well or if anything here is affected by seasonality of some sort.

However, by and large it looks like for all the attention that services gets – exports of engineering goods and refined petroleum products may just hold the key to run an export surplus.

Muthoot Finance Secured NCD Issue

Please go here for the latest post on the Muthoot NCD which opened on March 2 2012 and will close on March 17 2012. 

Muthoot Finance has raised quite a stir by coming up with a non convertible debenture (NCD) offer that’s offering upwards of 13% to investors.  This issue is quite different from the last Muthoot Finance NCD issue where the minimum investment amount was Rs. 1 lakh and there was just one option with a 2 year maturity.

In this issue, the minimum investment is Rs. 5,000 and they have four investment options.

The offer opens on December 22, 2011 and will close on January 7 2012. The lead managers are ICICI Securities Limited, AK Capital Services Limited, HDFC Bank Limited, and Karvy Investor Services Limited.

The NCD issue has been rated ‘CRISIL AA-/Stable’ by CRISIL and ‘[ICRA] AA- (stable)’ by ICRA, which is a good credit rating from both of these issuers.

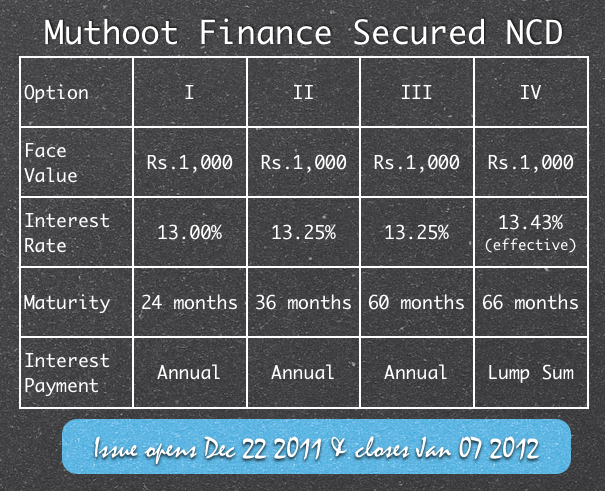
Here are details on the four options that the Muthoot NCD has on offer.

Muthoot Finance Secured NCD

The minimum investment is Rs. 5,000 which means you will have to buy 5 of these bonds at the minimum and they will list on the BSE after the issue closes.

Muthoot Finance’s latest quarterly report shows that the company has made consistent profits, and this is a secured NCD issue which means that certain assets of the company will be attached to the NCD in case of default. However, this doesn’t mean a guarantee of any kind, and if it comes to a default then investors might get less than the face value of the bonds.

I would say what I said the last time they came up with a NCD, which is that you shouldn’t be exposed to a lot of this in your debt portfolio. The yield is good, the company is currently doing well,  and that makes it easy to get swayed by the high yield and put in a big sum in it, but I think that won’t be wise.

You don’t want a lot of your money in just one type of debt instrument simply because if anything were to go wrong with that one thing – it will be devastating for your portfolio. I know it doesn’t look probable right now, but it didn’t seem probable that the Sensex will close near 15,000 at the beginning of the year either.

This post is from the Suggest a Topic page. 

Target Investment Plan by ICICI Direct

Sindhu wrote in about a month ago inquiring about ICICI Direct’s Target Investment Plan (TIP) scheme and if it’s any better than the systematic investment plans that you normally have at other brokers, and of course ICICI Direct as well.

The way the Target Investment Plan works is that instead of specifying a fixed amount that will be used to buy mutual funds every month – you specify a target, a rate of return, and time frame in which you want to get to that target.

The TIP system will then alter your monthly contributions based on the current value of your portfolio. The example in the PDF that I’ve linked to above explains the mechanics quite nicely, so I’m going to use the same example here.

Suppose, you want to have a sum of Rs. 10 lacs after 7 years, and you decide on an expected rate of return of 12%. If this rate were to be uniform throughout the 7 years – you will have to invest Rs. 7,700 every month.

However, equity investments are inherently volatile and say at the end of the first month – you find that your first installment of Rs. 7,700 is only worth Rs. 7,000 now. The system will recalculate your next installment to find out what amount is needed now to reach your goal. In this case it is Rs. 8,400, so they will deduct that from your account and invest it in your mutual funds.

Similarly, if the portfolio value gains then they will reduce your installment with the newly calculated sum and use only that much money to buy your mutual funds.

This is an interesting concept, and I think you could do one of these in addition to your SIPs but I won’t be in favor of getting rid of SIPs altogether for this.

One reason for that is if the system determines that you are ahead of your target and reduces your mutual fund investments, then what happens to the cash that is spare – are you vigilant enough to invest it yourself in other equities or are you going to invest it in fixed debt instruments or will it just lie there in your savings account?

The second reason is that this system will add a layer of complexity to your investment process because I don’t think it’s possible to correctly ascertain how much money will be needed in the coming month especially with how volatile the stock market can get. So, that’s one more thing you have to keep track of.

The third reason is that while you can cancel the TIP – you can’t modify it so if you find out midway that you want to invest more or reduce your target then you will have to find another avenue to do that.

The fourth reason is that the success of this system is more or less to do with timing the market and as we know that doesn’t work very well most of the time. If it would, then you’d see mutual funds that make buy decisions based on P/E multiples do better than every other class of funds.

The fifth reason is that it’s a relatively new product, and you don’t want to put all your money in this without trying it out for some time and seeing how it works for you.

These were product specific thoughts, but if you look at this at a slightly higher level you’d see that what you want to achieve with this product is to invest more of your money in equities when the market is low (like it is today) and pull back from them when the market is high.

There is nothing that stops you from doing this yourself – if you have a few SIPs going – you can invest additional sums yourself when the markets are low – and the lack of a system is not preventing you from doing it.

It’s the uncertainty that surrounds the market when it’s down that prevents you from doing it, and that’s why you see people stop their SIPs or sell their stocks at a loss in times such as today. To that extent, this product will not be able to help you help yourself, and that’s something that you will have to overcome yourself.

In summary, I think this can be a useful product and can be tried out in addition to SIPs by choosing reasonably small targets over a shorter time frame to start with, but I wouldn’t go as far as to replace SIPs with them.

No growth, no fur and no gas

The best piece I’ve read on the Indian economic malaise is Shekhar Gupta’s editorial in the Indian Express where he talks about the various policy failures and self inflicted problems that are worsening the Indian economy.

I can’t think of even a single economic metric that has improved in the last two years, and if things continue to be this way then we’re in for some bad times ahead.

It is no surprise then that Morgan Stanley’s 2012 Indian outlook predicts a pre – crisis level growth. They forecast a 6.9% GDP growth rate in 2012, and while these estimates tend to go wrong and have to be revised several times – they do accurately reflect the gloomy scenario that we see today.

Beyondbrics reports on a dispute between Reliance Industries and the government which is in turn delaying BP’s participation in Reliance’s deepwater exploration.

China has had problems of its own this year, and their stock market has done quite badly (not as bad as Indian ones though), and that’s one reason why a hedge fund that shorted the credit of companies that will do badly in a Chinese slowdown has returned over 52% this year.

The problems of the BRIC countries are getting quite a lot of attention these days, and I see quite a few references of BRIC as Beyond Ridiculous Investment Concept on my Twitter feed these days.

Over at the US, they are fighting a bill that allows censorship of the internet, and several prominent American businessmen and investors have been writing about it for quite some time. Sergey Brin joined them yesterday.

Prof. Jayanth Varma gives a few examples of currency breakups.

Finally, a new theory on why we lost our fur.

Enjoy your weekend!

The terrible IPOs of 2011

2011 has been a particularly bad year for Indian IPOs, and I see that out of the 30 odd IPOs that came out in 2011 – 14 have fallen by more than 50%!

As if that wasn’t bad enough – there are 9 that have fallen by more than 80% and 1 that has fallen by more than 90%!

I don’t have numbers for the IPO bust after the tech bubble when even cement companies started putting infotech in their names and came out with IPOs, but barring that time – I think this must be the most terrible time for Indian IPOs.

Here is how the complete list looks like.

Sr. No. Name of the issue

LTP

Issue Price

Date of Listing

Profit / Loss

1 TAKSHEEL SOLUTIONS LIMITED

14

150

19-Oct-11

-90.67%

2 BHARATIYA GLOBAL INFOMEDIA LIMITED

10

82

28-Jul-11

-87.80%

3 BROOKS LABORATORIES LIMITED

14.15

100

5-Sep-11

-85.85%

4 PARAMOUNT PRINTPACKAGING LIMITED

5.05

35

*

-85.57%

5 ACROPETAL TECHNOLOGIES LIMITED

13.1

90

10-Mar-11

-85.44%

6 SHILPI CABLE TECHNOLOGIES LIMITED

10.15

69

8-Apr-11

-85.29%

7 INDO THAI SECURITIES LIMITED

11

74

2-Nov-11

-85.14%

8 SERVALAKSHMI PAPER LIMITED

4.45

29

12-May-11

-84.66%

9 VASWANI INDUSTRIES LIMITED

9.15

49

24-Oct-11

-81.33%

10 SANGHVI FORGING AND ENGINEERING LTD

24.5

85

*

-71.18%

11 PTC INDIA FINANCIAL SERVICES LIMITED

10.5

28

30-Mar-11

-62.50%

12 M AND B SWITCHGEARS LIMITED

80.9

186

20-Oct-11

-56.51%

13 TIMBOR HOME LIMITED

27.8

63

22-Jun-11

-55.87%

14 SRS LIMITED

36.25

58

16-Sep-11

-37.50%

15 OMKAR SPECIALITY CHEMICALS LIMITED

62.65

98

10-Feb-11

-36.07%

16 INNOVENTIVE INDUSTRIES LIMITED

82

117

13-May-11

-29.91%

17 SUDAR GARMENTS LIMITED

55.7

77

11-Mar-11

-27.66%

18 L&T FINANCE HOLDINGS LIMITED

44.7

52

12-Aug-11

-14.04%

19 MUTHOOT FINANCE LIMITED

157.55

175

6-May-11

-9.97%

20 TD POWER SYSTEMS LIMITED

231

256

8-Sep-11

-9.77%

21 FUTURE VENTURES INDIA LIMITED

9.1

10

10-May-11

-9.00%

22 PG ELECTROPLAST LIMITED

220

210

26-Sep-11

4.76%

23 TREE HOUSE EDUCATION & ACCESSORIES LIMITED

159.9

135

26-Aug-11

18.44%

24 INVENTURE GROWTH AND SECURITIES LTD

154

117

*

31.62%

25 PRAKASH CONSTROWELL LTD

204.9

138

*

48.48%

26 LOVABLE LINGERIE LIMITED

317.5

205

24-Mar-11

54.88%

27 FLEXITUFF INTERNATIONAL LIMITED

241.5

155

19-Oct-11

55.81%

28 AANJANEYA LIFECARE LIMITED

425

234

27-May-11

81.62%

29 RUSHIL DECOR LIMITED

137

72

7-Jul-11

90.28%

30 ONELIFE CAPITAL ADVISORS LIMITED

231

110

17-Oct-11

110.00%

This year should have seen a number of public sector IPOs and FPOs, but we just had the one PFC issue and then due to the depressed market conditions – the government didn’t come out with any other offers, and is now asking PSUs to buyback their own shares in an attempt to meet the Rs. 40,000 crore disinvestment target from there.

The IPO situation has been going bad for some time now, and low quality issues combined with a punting mentality has rendered this  market completely useless for long term investors. I don’t see this situation changing in 2012 either, and while we may see a few good companies here and there, by and large 2012 would probably be more of 2011 as far as IPOs are concerned.

Dividend History of the Best Dividend Paying Shares

Dev left a very good comment on yesterday’s post about the best dividend paying stocks which said that while it’s good to have the list of current yields, it’s also important to look at the consistency with which these companies have paid dividends.

That is a very valid point and I took a look at the dividend paying history of all the stocks that I mentioned yesterday plus SCI which has a very good yield, was present in my earlier posts but I somehow missed yesterday. Thanks to Mr. VKD Menon to point that out.

I’ve taken the dividend history data from the NSE website, and right now I think that’s the best source to get this data. You can find calculated dividend yields on other websites, but I’ve found a lot of the numbers to be inaccurate, and that’s primarily the reason I didn’t use any website but rather took the share price and dividend paid and then calculated the numbers myself.

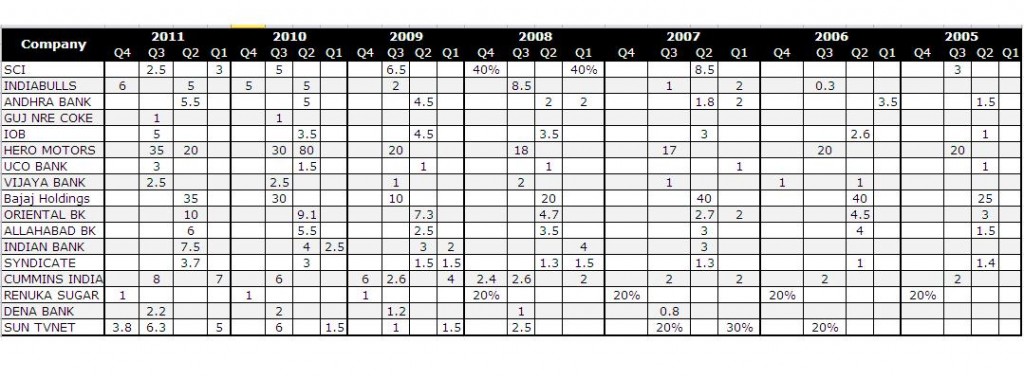
With that said, here is the table that contains the dividend paying histories of some of the best dividend paying companies in India. (Click to enlarge)

Dividend Payment History

The quarters in the above chart are based on calendar years for ease of use, and when I’ve used percentages it’s because there was a share split or bonus in the share and the NSE website listed the dividend as a percentage of face value instead of the amount, and that may be inaccurate.

Looking at this data shows that while most of these companies have been consistent dividend payers – India Bulls and Sun TV has hiked the dividends only recently, and you never know if that will continue or not. Even Cummins India has had a good dividend payout this year but the only other year when the dividends have been these high was 2009.

I don’t notice anything unusual in any of the other stocks, but if you do then please do leave a comment.

Some of the best dividend yield shares in India

About three months ago I did a couple of posts on the top 100 and top 200 high dividend yield shares in India. I wanted to cover the next 200 shares or so as well, but since the market has been quite choppy in the last 3 months I wanted to see if any of the original high dividend yield shares have gone down to levels that make the yields very attractive.

I looked at the all the high dividend yield shares from those two posts, and removed the ones that didn’t have any dividend paid at all in 2011.

After that I took the price of today’s close and re-calculated the dividend yields on each of these stocks. I then took the shares which had more than a 3.00% dividend yield and went to MoneySights to get the market capitalization, P/E ratio and Debt / Equity ratio of these shares.

Here is what the result looks like.

Company

Close Price

Dividend Paid

Dividend Yield

Market Cap

P/E Ratio

Debt Equity Ratio

SCI

56.15

5.50

9.80%

  2,618.00     Loss

0.66

INDIABULLS

145.55

11

7.56%

4,530.00

6.65

3.17

ANDHRA BANK

93.25

5.5

5.90%

5,218.00

3.79

GUJARA NRE COKE

17.25

1

5.80%

905.00

8.23

0.67

INDIAN OVERSEAS BANK

86.45

5

5.78%

5,349.00

4.84

HERO MOTORS

2003.45

110

5.49%

40,006.00

18.87

0.5

UCO BANK

60.9

3

4.93%

3,822.00

3.44

0.35

VIJAYA BANK

53

2.5

4.72%

2,500.00

5.01

0.36

Bajaj Holdings

688

35

4.36%

7,657.00

10.04

ORIENTAL BK

252.45

10.4

4.12%

7,366.00

5.73

VST Industries

1125.00

45

4.00%

1729.00

14.69

ALLAHABAD BK

151.35

6

3.96%

7,208.00

4.47

INDIAN BANK

189.35

7.5

3.96%

8,138.00

4.52

SYNDICATE

94.3

3.7

3.92%

5,406.00

4.44

CUMMINS INDIA

337

13

3.86%

9,342.00

15.89

RENUKA SUGAR

28.45

1

3.51%

1,910.00

38.65

0.74

DENA BANK

63

2.2

3.49%

2,100.00

2.93

SUN TVNET

262.65

10

3.33%

10,351.00

13.04


As you can see there are a fair number of large companies that have decent dividend yields, low P/Es and low Debt / Equity ratio. I’ve only looked at large companies and used the Debt / Equity ratio because that indicates stability and the chances of these companies going bankrupt and the share price going to zero is lower than smaller companies with high debt on their books.

P/E ratio is a quick measure of finding out if the share is over priced or not, and that’s the reason I’ve included that in this table.

I’ll continue to add to this list and if you know any good dividend yield shares not present here please do leave a comment and I’ll include them here.

Just looking at this table – I don’t think any company stands out as too good to miss which is what I was hoping for when I started to create this list.

Another thought on this list is that it is not as useful as a list of high dividend yield stocks in the US because it is primarily dominated by banks and if you don’t want to take exposure to that sector then there aren’t many options outside that.

Update: VKD Menon emailed that SCI was missing from this list and I’ve added it now. 

Why I continue to invest in stocks?

As the investment climate turns more pessimistic by the day – more and more people are turning away from the stock market – and I’m being asked by friends why I continue to remain bullish when there is so much bad news coming in from all directions.

The answer to that is I’m not bullish in the sense that the market will go up next month or next year or in any other ways that people generally think about being bullish. Yes, I’ve bought stocks in the last few months, and will continue to do so in the coming months, but the reason for that is not because I’m bullish in the sense that most people think about it.

I have no idea where the market will be next month or next year or two years down the line, but I do believe that companies will continue to exist and make profits many many years down the line, and as long as I invest in companies that don’t go bankrupt and with money that I won’t need in a hurry I think I will come out fine.

I recently re-read some parts of The Intelligent Investor, which is of course considered the bible of value investing, and I think two excerpts from the book capture how I feel quite nicely.

Here is the first one:

A stock is not just a ticker symbol or an electronic blip; it is an ownership interest in an actual business, with an underlying value that does not depend on its share price. The market is a pendulum that forever swings between unsustainable optimism (which makes stocks too expensive) and unjustified pessimism (which makes them too cheap). The intelligent investor is a realist who sells to optimists and buys from pessimists.

Except for the first one or two years of investing when I was still in college – I’ve viewed stocks as representatives of companies and that makes it a lot easier to go through all the volatility that exists in the market today, and has always existed.

I think this mindset improves the chances of investing success phenomenally but I have no illusions of never making any mistakes, and I’m pretty sure there will be some mistakes and that’s really not in my control. I can’t be error free but I can diversify in a way such that those errors are not very costly.

Jason Zweig has added commentary to the issue of The Intelligent Investor I currently have, and I think this excerpt captures the essence of what I want to say about errors quite nicely.

The probability of making at least one mistake at some point in your investing lifetime is virtually 100%, and those odds are entirely out of your control. However, you do have control over the consequences of being wrong. Many “investors” put essentially all of their money into dot-com stocks in 1999; an online survey of 1,338 Americans by Money Magazine in 1999 found that nearly one-tenth of them had at least 85% of their money in Internet stocks. By ignoring Graham’s call for a margin of safety, these people took the wrong side of Pascal’s wager. Certain that they knew the probabilities of being right, they did nothing to protect themselves against the consequences of being wrong

In my opinion – I can be wrong about two things – first about investing in stocks itself – five years down the line I could find that companies aren’t making profits any longer or less than they were five years ago and the macro situation was so bad that stock prices are just a third of what they were a few years ago. And to get away from this risk one could invest in debt instruments, real estate, gold or just keep cash – basically not invest 100% in stocks.

The second risk is stock specific risk and to get away from that you can invest in multiple stocks and especially stocks that have been around for decades, have low debt, high dividends and good fundamentals. This will at least minimize the chances of bankruptcy and if you have ten stocks in different sectors or large cap diversified mutual funds then you are protected from stock specific risk quite easily.

I’m not a market trader and I don’t pretend to understand everything that’s happening in Europe or how it will play out in the future – but I do know what has worked for me in the past and I have high confidence that companies that have been around for decades will continue to exist in the future as well and make profits. At this point, this is enough to make me interested in stocks, and be bullish as they say.

Signs of under performing mutual funds

Over the weekend I got an email from a reader who had a question on how to identify under – performing mutual funds, and in what way should one get rid of them.

I think this is a difficult question, and I don’t think there are any straightforward answers to it, but there are certain things that do come to mind.

Before getting to those things though, you need to ensure that you really are comparing the fund to its peers and not being harsh on it.

Remember, that an equity fund will only go up if the stock market has been up, and you can’t punish an equity fund for being down if the whole market is down. Small caps generally fall a lot more than large caps, so in down markets you will find that funds based on small caps are also down a lot more, and that’s not really a sign of under performance. The mutual fund is supposed to own small caps, and if it’s down as a result of that – then that’s really not the problem of the fund.

You need to evaluate the mutual fund against its peer group and if it has been down in that peer group, then that’s a sign of under performance, not otherwise.

Now, let’s look at some things that you can do to sniff out under performance, and let’s start with the obvious things first.

Was the fund sold to you?

I think the first thing you need to look at is why you bought a particular mutual fund, and have the conditions that existed when you bought the fund changed now. Looking at the huge volumes that mutual fund NFOs get, I think there are a lot of people who don’t really buy mutual funds, but they get sold to them.

If you have a fund that got sold to you, then it’s a good idea to evaluate how well it has done compared to its peers, and if there are other options with longer histories, and better performance then it makes sense to switch to those.

New information about the fund manager

If you bought the fund because of the fund manager and you find out some new information about the fund manager that makes you view him in a different light then that’s probably a sign of re-evaluating your decisions.

For example, Sandip Sabharwal is a well known fund manager in India and blogs as well. In going through his blog – I read a post where he discusses financial astrology and that made me view him in a completely different light, and I don’t think I will ever invest in a fund that he manages.

Thin Volumes

It’s always better to be in a fund with good volumes and a decent volume of assets under their management so if you are in a diversified large cap mutual fund which has just a fourth of the assets that another fund of similar type has, then it’s probably better to switch to that fund.

These were some obvious things, but what if the mutual fund has been a consistent performer in the past, but has started doing badly recently?

Is it high cost?

Look at the expense ratio of the peers and compare it with your fund – if it’s too high then that may as well be a reason of why the fund isn’t performing well.

If the fund expense ratio is high then that itself takes a big toll on the fund performance and it’s better to switch to low cost funds.

So, if you had something like HDFC Top 200, which is a good fund and you saw that it started under performing the market – how do you know whether you should give it the benefit of the doubt or should get rid of it?

If such a thing were to happen to one of my holdings, then I would like to see if the fund manager changed or not, and if they didn’t then I’d like to continue holding the funds, and give the fund manager the benefit of the doubt. But for how long? I will probably stick three years or so and in that time start investment with another fund as well, but I think if you have a shorter period then it is likely that you keep chasing one high return fund after the other.

I’d much rather be in a few high performing funds to start with, and that way the chances of all of them turning down at the same time reduces. There is no science behind this number of three years, just a feeling that this number is neither too short nor too long, and is a reasonable time frame.

I think a large part of the gains you get from equity will be because the market itself has done well, and a good fund manager may be able to juice up the return a bit but asset allocation and being in the market itself through decent funds is a more practical and achievable goal than trying to find the best fund within a category.