I wrote about Franklin Templeton Dynamic PE Ratio Fund a little under two years ago, and I thought of looking at its recent performance when Business Line put in a buy recommendation for the fund in a recent article.Â
Essentially what this fund of funds does is allocate money in a debt or equity fund based on what the current P/E ratio of the market. This way it can allocate more money to equities when the market is down, and allocate more money to debt when the market is high and risks going down. Currently it has 60% in equity and 40% in debt.
The two fund it invests its money are Franklin India Bluechip Fund and Templeton India Income Fund.
Now let’s take a look at how these three funds have performed in the past few years.
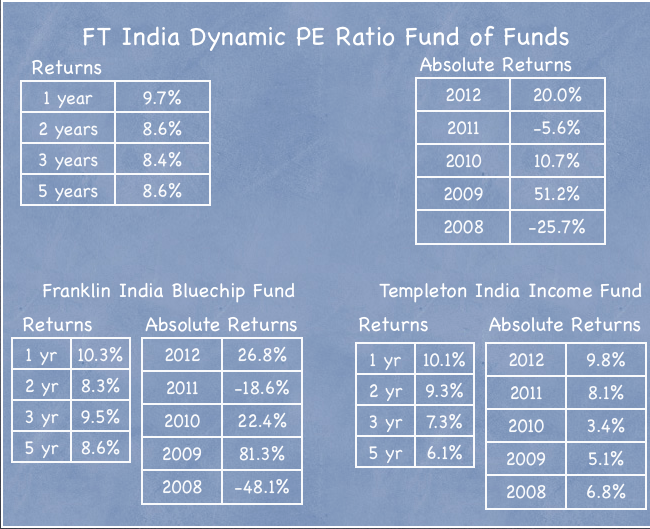
I think the chart above is a very useful way of looking at these three funds and see what’s going on in their performance.
Franklin Templeton Dynamic PE Fund returns similar to the returns of Franklin India Bluechip Fund
What strikes me most about this is that FT India Dynamic PE Fund has returns that matched the Franklin India Bluechip Fund in the longer run, and wasn’t able to out do it even when the equity markets haven’t been good for the past few years.
Protection against volatility
The second thing that strikes me about this is that if you wanted to invest in equities but were wary of the volatility and sudden crashes of the market then this would have proved to be a good option as it protected you from the violent downswings that the past few years have brought in the equity market.
Templeton India Income Fund dragging down returns
Moneycontrol ranks this income fund as one of the lower returning ones based on past returns and that has been consistent over the past few years, so you can see that this fund has been dragging down the returns of the Dynamic PE Fund as well.
Returns comparable to balanced funds
When I wrote about this fund almost two years ago I made the following observation about it with respect to balanced funds:
The fund still beat its benchmark but if you look at my best balanced funds post you will notice that there are quite a few funds that have bettered this performance over the 3 year and 5 year range.
So, when thinking about investing in a PE fund – whether this or another – just take a look at how other balanced funds are performing as well because they are similar in structure.
A good balanced fund like HDFC Prudence has returned 11.2% annualized in the past 5 years which is higher than this and while it is not fair to pick just one good balanced fund and compare its return with this fund the point I’m trying to make is that balanced funds that don’t rely on P/E strategies but invest about 35% or so in debt regardless of P/E levels have been doing at least as well as this fund.
P/E Strategy No Magic BulletÂ
Theoretically, the P/E strategy sounds good – you invest more when the market is down and more when the market is up, but in practice it’s no magic bullet. The fund has done well, and there is no harm in investing in such a fund, but where you would go wrong is to expect some kind of sensational returns. In the past it has performed like a balanced fund, and these are decent returns when thinking about how the equity market has done in the same time frame, but that’s about it – it hasn’t given you an edge over them, and won’t do so in the future either.
Source of returns:
Related articles


