Change of DDT from 12.5% to 25% for Debt Funds

One of the more unpopular things from the recent budget was increasing the Dividend Distribution Tax (DDT) from 12.5% to 25% on all debt mutual funds from 1st June 2013. (Clause 29, Budget Memorandum)
Mr. K Srinivasan had the following question:

Hi Manshu,

Query Subject: Recent Budget-2013 change of DDT from 13% to 25% for Debt Funds

In the recent Budget-2013 PC has increased the DDT tax on Debt Funds from approx 13% to approx 25% . This has made Returns from investments in these Debt Funds, (esp for retirees with Monthly or Quarterly Dividend Payout options for having regular income) in these Debt Funds (vis-a-vis Bank FDs) unattractive. This may be affecting even Debt Conservative i.e. MIP funds?

My questions are:
1) Which classes of Debt Funds are affected?
2) What remedial action is suggested?

Some people have suggested switching toGrowth Option and then use SWP to get regular incomes. Is that a good option? If so, when to switch to Growth and what aspects to take care while doing so in terms of Short-Term Capital gains, Exit load windows etc.??

Would welcome a comprehensive reply on this topic. If already covered please proved a pointer link.

K. Srinivasan

Prior to this change, only liquid funds had a DDT of 25% while all other debt funds had a DDT of just 12.5%. DDT is charged when the mutual fund declares a dividend and is paid by the mutual fund and not the investor. Now all types of debt mutual funds will have to pay 25%.

This will of course still reduce the income of the mutual fund unit holder as the mutual fund will have to declare a lower dividend and the unit holders will now get lower income.

To understand how this will affect returns, let’s take a look at how SBI Dynamic Bond Fund (D) paid out dividends in the last year.

Here is the dividend history.

Date

Rs. / Unit

26-Dec-2012

0.21

26-Sep-2012

0.21

26-Jun-2012

0.21

30-Mar-2012

0.19

SBI had to pay a 12.5% DDT every time it declared the dividend and had there been zero tax on dividends, SBI would have declared a Rs. 0.24 dividend instead of a 0.21 dividend and a 0.22 dividend instead of a 0.19 dividend.

This can be seen in the table below, and you can also see what effect a 25% dividend will have on this return.

Money Available for Dividend DDT at 12.5% Dividend to unit holders DDT at 25% New Dividend to unit holders
0.24 0.03 0.21 0.06 0.18
0.24 0.03 0.21 0.06 0.18
0.24 0.03 0.21 0.06 0.18
0.217 0.027 0.19 0.05425 0.16275
Total Old Dividend 0.82 Total New Dividend 0.70
Difference 14.3%

There is apparently a surcharge also so you can see this is a meaningful impact, and it would be good if there were a way to avoid this extra hit.

In order to explore that you need to take a view on how short term, long term and dividend distribution taxes are charged on debt funds. Here is a table that shows that.

Asset Class Classification as Short term or Long term Long Term Capital Gains Short Term Capital Gains Dividend Distribution Tax
Debt Mutual Fund Less than a year is short term and more than a year is long term 10% without indexation or 20% with indexation whichever is lower plus surcharge and cess Gains taxed on investor’s slab. 25%

Based on the table above the following things come to mind:

Don’t Incur Short Term Capital Gains

Short term capital gains on the highest bracket can be upwards of 30% so there is no point in selling your dividend oriented units because of this rule change, and incurring those taxes. Let the units be at least a year old before you sell them so you incur long term capital gains, and not short term capital gains.

Tax Arbitrage between FDs and Debt Fund Not Completely Eliminated

The idea of bringing out this higher DDT rate is to close down the arbitrage between fixed deposits and debt funds due to the difference tax rates. And while this step largely does so in terms of dividend plans, it doesn’t do so for the growth option of the same mutual fund and the growth option is still more tax efficient than a fixed deposit.

Growth Option of Debt Mutual Funds is the Best Option

Given all these things, I feel that if you owned a debt mutual fund with a dividend option right now, your best bet is to change that to the growth option, and then either redeem units periodically or choose a Systematic Withdrawal Plan (SWP).

Other than that, I don’t see how you can avoid this tax incidence, and with this higher tax rate, I don’t see a reason to stick to the dividend option, and definitely no reason to buy new units of dividend oriented funds.

Short Term Capital Gains and Exit Loans

If you are stuck in this situation, you have to be mindful of the fact that you own the funds for at least a year so you don’t incur any short term capital gains by selling them now, and then most of these funds also charge a 1% exit load if you redeem within a year and you will be hit by that as well. So these two things should be given a lot of importance before making any decision.

Conclusion

Unfortunately, there is not much you can do in this situation, and the only other thing that I can think of is to increase exposure to tax free bonds because other than that all instruments do have a fairly high tax incidence. The main drawback of those is that you get the interest only once a year and if you were depending on them for regular income then that will not work. The rate of interest is lower than debt funds too but then post tax, it may match up or be a bit higher, and there is no uncertainty of returns with those as well.

Update: 

Pankaj Jariwala wrote in with the following information, which I thought was useful to know,

hello

Many mutual funds do not charge exit load if you simply change the option from dividend to Growth. One may confirm this with the mutual fund he/she is holding

But your date of investment (for capital gain purpose) will be from the date you change your plan from dividend to Growth

so do keep the above things in mind too

thanks

pankaj

This post was from the Suggest a Topic page.


What is the Sensex high adjusted for inflation?

The Dow hit a new record high of 14,253.77 today and at least I was very surprised by this new record. There were a couple of things that caught my eye while browsing through stories about this high, and I was curious to see how they were applicable in an Indian context.

The first one was simply that the Dow has more than doubled from its 2009 low, and the last 4 years have been a great bull market. I’m not sure how I feel about that. It is factually correct, but if you recall the terrible sentiment that existed in the last four years, I don’t know that you would have known you are in a bull market from that.

But does it hold true in an Indian context as well? Has the Sensex more than doubled in the last four years?

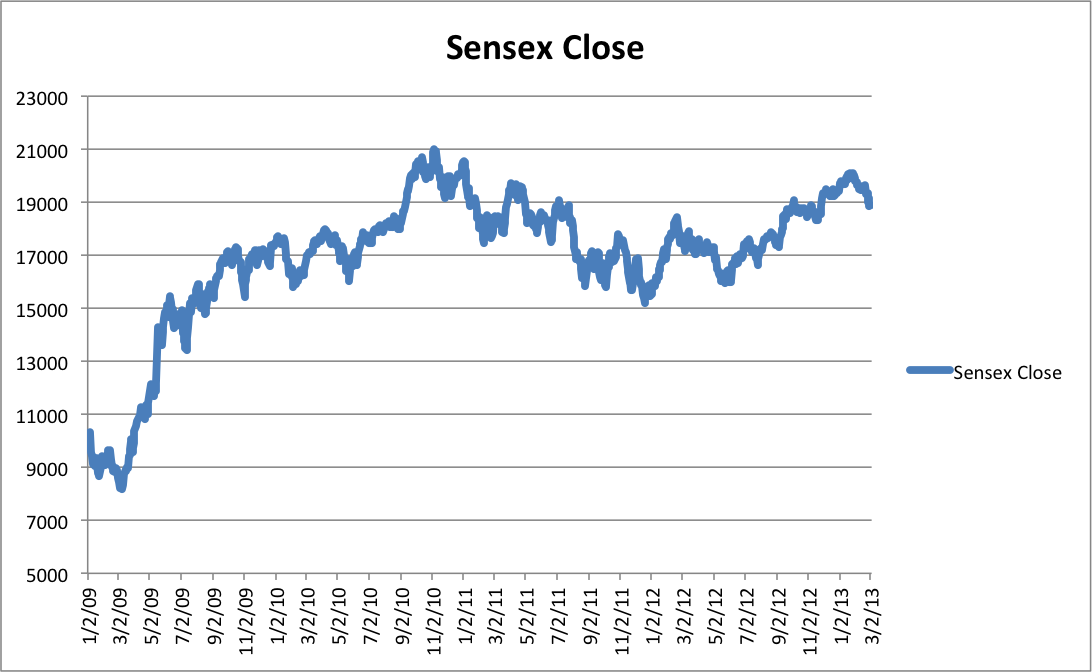
A chart is in order. This is the Sensex close from Jan 2009 till yesterday.

Sensex Jan 2009 Mar 5 2013

The lowest point on this chart is 8,160.4 on September 3 2009. So, yes, the Sensex has more than doubled in the last 4 years. But the more important question is – have you taken advantage of this move?

Sensex High Adjusted for Inflation

The second thing that I saw at a few places today was that sure the Dow has hit a high, but it hasn’t been able to beat inflation. This made me wonder what the Sensex high would be if it were adjusted for inflation?

The all time Sensex closing high is 21,004 on November 5 2010.To adjust this for inflation, I went to the website of Labour Bureau of India.

They have historical CPI inflation data there, and I was able to look at the number for November 2010, and January 2013 (latest month for which number is available) and adjust the Sensex high for inflation.

The CPI index for November 2010 was 182, and the number for January 2013 was 221. So you can derive the Sensex high adjusted for inflation as (221/182) x 21004.

This comes out to be 25,505.

So based on this crude method, I’d say that Sensex high adjusted for inflation should be 25,505 and we shouldn’t be rejoicing till the Sensex blows past this number, but then given the current situation, it would be good to just see a new nominal high.

2013 Budget – Where does the government spend your money?

Yesterday I detailed out the sources of funds for the government and in today’s post I’ll show a break up of how the government spends your money.

There are two heads of government spending – Non Plan Expenditure and Plan Expenditure. Non Plan Expenditure is money that’s spent on sustaining the country like defense, postal deficit, subsidies etc. and Plan Expenditure is the money that is spent on improving the country like the money spent on dams, roads etc.

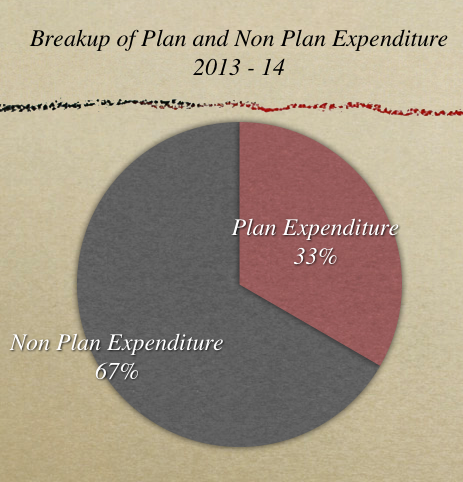
As you would probably expect, a lot more is spent on sustaining the country than is spent on improving it.

Plan versus Non Plan Expenditure

First, let’s take a look at the break up between the Plan and Non Plan Expenditure.

Head In Crore of Rupees
Plan Expenditure 5,55,322.00
Non Plan Expenditure 11,09,975.32
Grand Total 16,65,297.32

Here is a pie chart that shows how this breaks out.

Plan and Non Plan Expenditure

Non Plan Expenditure

Now let’s take a look at the break up of the non major expenditure items.


Head In Crore of Rupees
Interest Payment and Debt Servicing 3,70,684
Defence Services expenditure 2,03,672
Capital Outlay (excluding Defence) 30,131
Grants to State Governments 76,105
Pensions 70,726
Food Subsidy 90,000
Police 40,895
Grants to Foreign Governments 4,144
Transport 3,541
Petroleum subsidy 65,000
Other Non Plan expenditure 155,077
Grand Total 11,09,975

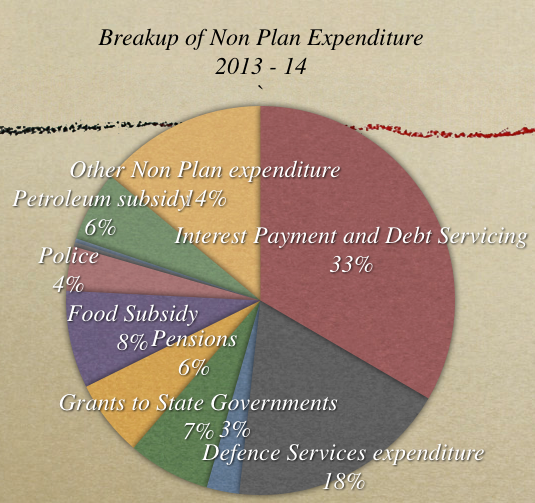
Here is a pie chart that shows the breakup of these numbers.

Breakup of Non Plan Expenditure 2013 - 14

For those who are not familiar with this, the biggest surprise will be how much we spend on interest payments, and the as you saw yesterday, the borrowing keeps rising and so the interest payment will have to go up as well.

Subsidies are another interesting item because it shows the strain on government finances, and even if you get something for less than the market price, ultimately you will have to pay for it.

Plan Expenditure

Now, let’s take a look at the major heads of Plan Expenditure.

Agriculture and Allied Activities 18781.28
Rural Development 42772.55
Irrigation and Flood Control 1200.00
Energy 158286.92
Industry and Minerals 48009.82
Transport 133488.05
Communications 12379.92
Science Technology & Environment 17586.79
General Economic Services 31602.43
Social Services 206708.92
General Services 9306.71
GRAND TOTAL 680123.39

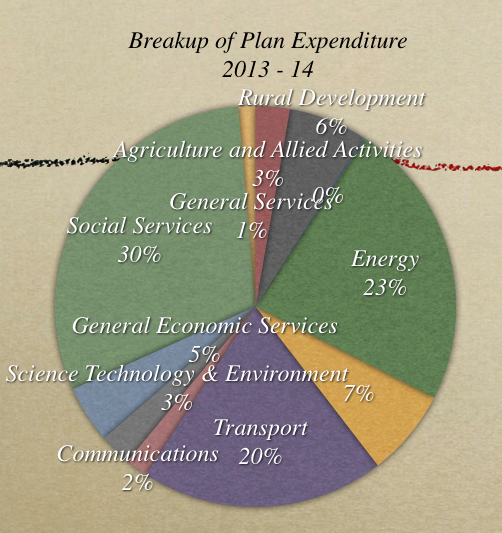
Here is a pie chart that shows the breakup of all these expenses.

Breakup of Plan Expenditure

Budget 2013 – Where does the government get its revenue from?

I have already written about some of the key features of the budget, and now let’s take a look at how the government gets its revenues. There are three sources from where the government gets money. The first two are revenue sources, and the last one is borrowings and capital asset sales.

These are listed here:

1. Revenue Receipts – Tax Revenue: This is the tax that the government collects in the form of corporation tax, personal income tax, customs, excise etc.

2. Non Tax Revenue: These are things like interests on bonds held, dividends from PSUs, and grants. They are revenue sources meaning they don’t have to be repaid and are smaller than tax revenues.

3. Capital Receipts: These are borrowings of the government like the market loans, short term borrowings, external commercial receipts etc.

Now, some charts and the source for the data is the budget website.

Breakup of Government Revenues

First, let’s take a look at how these three sources contribute to the government’s kitty.

Head In Crore of Rupees
Tax Revenue 8,84,078.32
Non Tax Revenue 1,72,252.38
Capital Receipts 6,08,966.62
Grand Total 16,65,297.32

Here is a pie chart that shows the relative contribution of these three sources.

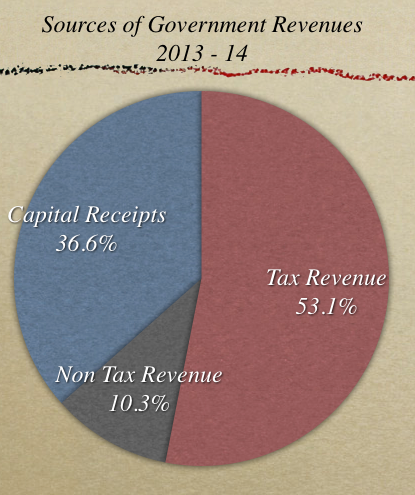
Sources of Government Revenues 2013 - 14

From the chart above you can see that tax revenues form the biggest chunk of government receipts. What’s also interesting is that Capital Receipts form 37% of the receipts. This is quite high because most of this is in the form of borrowings, and if this was the budget of a family they would be in trouble since they have to finance 37% of their expenses by borrowing money.

What’s amazing about this break up is that it is identical to the budget last year. Click here to look at that chart. 

Breakup of Tax Revenues

Tax revenues are the biggest sources of government funds, and now let’s take a look at what constitutes our tax revenues.

Head In Crore of Rupees
Corporation Tax  4,19,520.00
Income Tax  2,47,639.00
Wealth Tax  950.00
Customs  1,87,308.00
Excise Duties  1,97,553.95
Service Tax  1,80,141.00
Taxes on UT  2,758.13
Grand Total  12,35,870.08

The grand total here is a lot bigger than the tax revenue grand total in the first table because the first table has the tax revenues reduced by the state’s share of it.

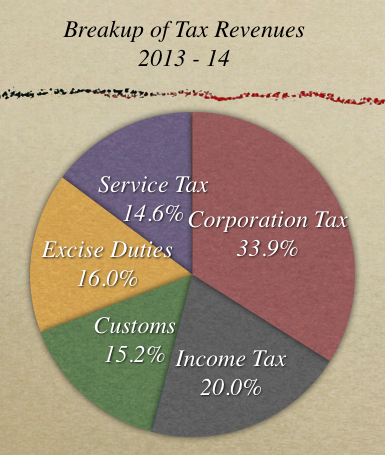
Here is a chart that shows the percentage contribution of these various sources, and for people not familiar with this breakup – the biggest surprise for them will be that Corporate Taxes contribute a lot more to the kitty than the personal income tax. If you compare this with last year’s number you will see that the the contribution of income tax has gone up 2 points in the overall pie.

Breakup of Tax Revenues 2013 - 14

Non Tax Revenues

Non tax revenues are not nearly as big as tax revenues and a lot of them come from PSU dividends and then some come from petroleum royalties that are covered in the Economic Services section below.

Here is the break up of non tax revenues.

Head In Crore of Rupees
Interest Receipts 17,764.39
Dividends and Profits 73,866.36
Fiscal Services 87.82
General Services 12,254.71
Social Services 2,684.42
Economic Services 62,972.64
Grants 1456.13
Non Tax Rev of UT 1165.91
Grand Total 172252.38

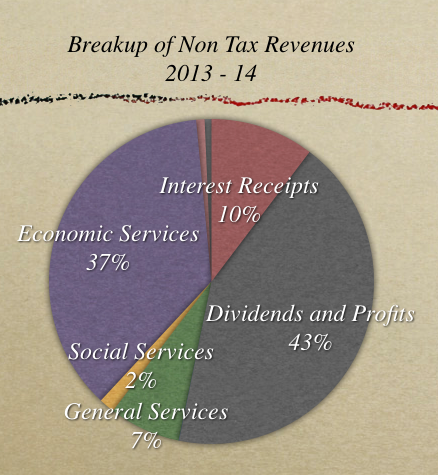
Here is how the various heads look like in a pie chart.

Non Tax Revenues 2013 - 14

The one thing that I always think about when I look at this number is the fact that India is slowly divesting PSUs and eventually these dividends and profits are going to go down. The other related thing is that the divestment money is being used to plug the gap between revenues and expenses, but divestment will not be a continual source of income like taxes.

Now, let’s move to the third source of income which is capital receipts.

Capital Receipts

As you can see the government has to rely a lot on Capital Receipts, and Capital Receipts are mainly just borrowings. The other big number there is disinvestments which comes under miscellaneous capital receipts and is Rs. 40,000 crores for this fiscal.

Here is how they break out.

Head In Crore of Rupees
Recoveries of Loans & Advances 10,654.00
Misc. Capital Receipts 55,814.00
Net Borrowings 503,844.46
Net Securities against Small Savings 5,797.52
State PF Net 10,000
Other Receipts 12,296.54
External Debt 10,560.10
Net Market Stabilisation Scheme 20,000.00
Grand Total 628,966.62

You will notice that this is Rs. 20,000 crores more than the capital receipts shown in the first table, and so far I haven’t been able to find out the reason for the difference. The number in the first table equals allows the total to add to the expenses and also the Reconciliation Statement on the budget website lists down the capital receipts as 608,966.62 crores so that number is the right Net Capital Receipts but I don’t know from which head the 20,000 crores has to be removed in the latter table.

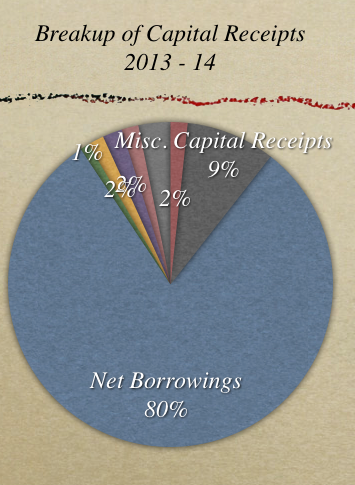
Here is a pie chart of the above numbers.

Capital Receipts 2013 - 14

Conclusion

We have been talking about deficit for some time here, and if you look at these numbers above – 36.6% of the total revenues are capital receipts, and 80% of those capital receipts are borrowings. So, effectively we borrow 29.3% of what we have to spend. That’s just too high, and has to be brought under control. When you look at it from this context, widening the tax base and better compliance is inevitable if you have to get this number under control.

2013 Budget Analysis

I did a detailed post on the budget analysis that was published on Moneycontrol  earlier in the day.

I covered most of the important aspects of the budget that are likely to affect someone from the working middle class, but in addition to that I also touched upon what the budget means to the government.

I think this is an important aspect that doesn’t get sufficient coverage because it affects us indirectly, and is perhaps not so apparent as say a surcharge of 5% would be.

I think it is important for us to understand not only things that affect us directly but also the reason why certain steps have been taken by the Finance Minister and his team of advisors. It is only when you develop a holistic understanding of deficits, inflation, subsidies, taxation and the interplay between them will you be truly in a position to understand why certain decisions are taken, and think about them intelligently.

I think this is important and the budget is a good opportunity to learn about some of these things and understand them better. This is a big reason why I’ve been doing the two posts on government income and spending for the last couple of years and will be doing them again this year as well, and will publish them shortly.

The post today doesn’t cover everything, but it does present a good start to get a more rounded view of the budget.

Click here to read Budget Analysis: How will the Budget 2013 impact you?

Â