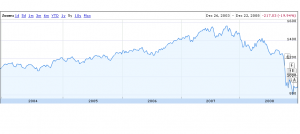
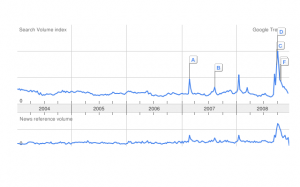
Have a look at the two charts below. The first one is the way the S&P has moved over the past few years. The next chart shows data from Google Trends. It shows the search volume for the phrase – “Stock Market” .
When I did the search on Google Trends – I was pretty sure, that I would find some trends between how the market behaves, and what people are searching on Google. But I was really astonished to see how similar both charts look for the latter part of 2008. A steep decline in both charts.
The same thing can be seen mid 2007 too – steep decline in both charts. To a lesser degree – the decline is present in the middle of 2006 also.
It seems that every market fall – also leads to a fall in people googling – “stock market”. There is some relationship between the spikes and busts in both charts, and makes for interesting reading. I am fairly certain this is just interesting reading – post the event – and will not help in predicting a fall. The reason for that is there is no way to tell – how far the rise will be; before dipping. It could be a short spike – like the one in 2007 or a bigger spike – like the one in 2008.


