The Lost Decade of Japan

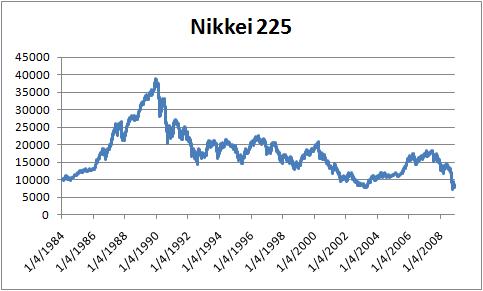
The period from 1990 to 2000 is known as the – Lost Decade in Japan. Japan grew at a staggering pace up until the late 80’s, on the back of its own real estate boom, and on December 29th 1989, Japan’s key stock market index – Nikkei 225 rose to a peak of 38916.

Much like any other bubble, Japan’s real estate bubble also burst in the 90’s and the economy went into a downward spiral. In an effort to save the economy from a crash landing and revive it, Japan lowered interest rates to 0% and funded bailout packages, one after the other.

In fact as late as 1999, Japan’s central banks were loaning out money to banks and other companies which were clearly not in a position to repay those loans.

The government bail-outs kept dead banks technically alive, but, they never recovered back to the point where they were really functional.

This gave birth to the term – Zombie Banks. The banks that received the funds were neither dead nor alive. The government pumped in money and the banks were not allowed to go bankrupt or die, but the general state of the economy never allowed them to work like an active bank.

Japan wanted to avoid a crash-landing and it did, but they paid a price in the bargain – a long period of stagnation.

A picture is worth a thousand words, and a look at the Nikkei 225; from Jan 1984 till Dec 2008 a 24 year period tells the whole story.

Its almost 18 years since the bubble bust, and Japan’s stock market is about 20% of its peaks.

To put things in perspective, for the US, this kind of situation would mean that the Dow Jones is about 2800 in the year 2026!

Eventually the government gave up its plans on keeping the zombie institutions alive and adopted a more market oriented approach.

There are eerie similarities between the current US situation and Japan of 18 years ago, both, in the way the bubble was formed and the response of policy makers.

Do you think the US is headed in the same direction?

Interesting Reads – 13th December

Here are some interesting articles from around the web this week:

1. Historical Distribution of the S&P 500: My Money Blog has got this interesting chart of how the S&P has performed since 1825. Incidentally, the year 2008 is among one of the worst in this chart!

2. Paul Krugman’s Nobel Prize Lecture: This is a recording of this year’s Nobel Prize winning Economist – Paul Krugman’s lecture in which he talks about his theory about international trade.

3. American Households Lost $2.8 Trillion in the last quarter: As always, Sun has got an interesting chart about how American wealth has moved over the past few years.

4. Interview with Nassim Taleb: This is an interview with Nassim Taleb – the author of – Black Swan. If you are not familiar with the concept, then, you may find this interesting. I think if you already know about what Taleb has to say – this interview doesn’ t have more to offer.

5. Stock Market Predictions from Bad News Bear: The Digerati Life talks about the Fortune article which lists down predictions from eight market experts. It is her conclusion (Stock Market Advice for Small Investors) that is really interesting and refreshing -so, if you have already read the Forbes article – jump right down to the conclusion of this one.

Fortune Magazine had this hilarious quote from Warren Buffet on the 0% Interest Rates –

“This should be bullish for Berkshire. With great foresight, I long ago entered the mattress business in a big way through our furniture operation. Now mattresses have become fully competitive as a place to put your money, and sales will soon take off.”

2009 Predictions by 8 Market Experts

Fortune Magazine spoke to eight eminent experts and took their view of the coming year. The article makes interesting reading, and here are some highlights:

1. Nouriel Roubini: According to the NYU Economics professor – also known as – Dr. Doom, this year is the year to stay in cash. Mr. Roubini advises to stay away from stocks, commodities, and credit in general. He advises to stay in cash or cash like instruments.

2. Bill Gross: Mr. Gross also predicts a grim 2009, and, advises to stay invested in high quality corporate bonds and preferred stock of financial institutions that have partnered with the government in programs like TARP.

3. Robert Shiller: So far Mr. Shiller has called the housing, as well as the dot com bubble, and, he is slightly more optimistic than the others. He says that – if you have an appetite for risk – you can invest in the markets because they are so low. But there is a good chance, that your investements may be halved too.

4. Sheila Bair: Ms. Bair talks about her mother, who is a long term investor – who bought stocks that she understood , and then held on to them for a long while. She did not say anything specifically about the next year.

5. Jim Rogers: Mr. Roger’s favorite has been  – agricultural commodities; for some time now, and, he has been talking about it quite often. He also recommends Chinese and Taiwanese stocks. His advise is to look for things whose fundamentals are not impaired.

6. John Train: Mr. Train is the first person on this list to advocate equities. He says that stocks are priced for a depression; when we may only see a recession. He says that companies like Johnson and Johnson are well equipped to deal with the current situation. Other companies that he mentions are Cisco, Apple, Microsoft, Berkshire Hathaway, Hewlett-Packard, Google, Intel, and IBM.

7. Meredith Whitney: Ms. Whitney rose to fame when she first predicted the dire straits that Citi would get into. She has a pessimistic outlook on 2009, and, thinks that things are going to get worse in 2009 in terms of consumer spending and the economy in general.

8. Wilbur Ross: Mr. Ross is the only one in the list who has started investing in the distressed financial firms – and hopes that they will make a comeback soon.

While the mood of most in this list is sombre – the investment tactic differ quite significantly. That is a measure of how complex decision making has become in these bleak times.

FXA – Australian Currency ETF

A very interesting thing about the current financial crisis is the rise of the US Dollar. Its interesting because when economies collapse in other countries – the national currency also crashes. However, as the US economy heads for a deep recession, the dollar gains in strength every day.

The dollar has gained against all major currencies (except the yen), and especially against the Australian Dollar. To put things in perspective, when compared with other currencies, the Australian Dollar did gain significantly more against the US dollar, in the past year or so.

Australia is a resource rich country and exports a lot of its minerals to countries like – China, which will spend a lot on expanding its local infrastructure in the next few years.

The fact that a substantial part of China’s stimulus package is devoted to building infrastructure is good news for Australia. The other positive thing about Australia is that it is one of the few developed countries that have been impacted very little by the global crisis.

How to invest in the Australian Dollar?

For an ordinary investor, the easiest way is – buying an Exchange Traded Fund that tracks the price of the Australian dollar against the US dollar.

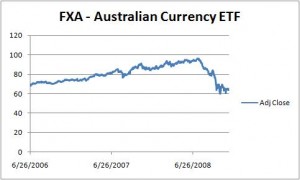
Currency Shares Australian Dollar ETF (FXA) does exactly this. Here is a chart of how it moved over the last couple of years.

Here is a list of some other currency ETFs that you may be interested in.

You can invest directly in Forex too, but, that may not be a good option for regular investors as the leverage in Forex is much higher than equities and you may stand to lose a lot of money.

Note: I am not a financial advisor and this should not be treated as a buy recommendation on the ETF.

Inflation – The Invisible Tax

Not many people think of it that way, but, inflation is a form of tax also. Inflation reduces the value of your money as it increases the price of goods and services – as a result you can buy less with the same amount of money.

For example, if you earn $100 and pay $5 dollar in taxes, then your real purchasing power is just $95 and not $100.

Similarly if there is an inflation of 5% per year, then you will need $105 to buy stuff worth $100 in an year’s time.

So, inflation works like income tax. The only difference is that every one has to pay it, unlike income taxes.

Debt gets Cheaper

Right now the United States is stimulating the economy by pumping in dollars in the form of bailouts and stimulus packages.

It is mainly doing so by selling T-Bills and other debt instruments and creating debt. It is also doing that by other means, but let’s just stick to the government debt for a while.

Inflation helps you repay lesser than what you actually borrowed.

Assume that there is an annual inflation of 100% in the economy. So that means that 100 dollars today are worth 200 dollars next year.

In this economy if you take a loan of $100 with an interest rate of 5%, you will have to repay $105 dollars after an year. But with an inflation rate of 100%, you have really saved yourself $95!.

This is because the goods and services you can buy today for $105 are much more than what will be able to buy, one year down the line. Since a dollar today – is worth two in an year.

Conclusion

Most people do not think of inflation as a tax mechanism and as a way to reduce the real debt – this angle is completely missed while thinking about stimulus packages and such. More importantly, this angle is sometimes missed, when you are taking a loan or investing money in any other means.

India jumps on the Stimulus Package Bandwagon

Over the weekend the Indian Government announced a stimulus package targeted at dealing with the global recession. The government estimate for GDP growth this year is 9%, and, the global recession is expected to shave off about 2% from this.

The stimulus package is $4 billion dollars, and, is much smaller than that of China or US (even as a percentage of GDP).

This is expected to get bigger next year when the government announces its budget for the next fiscal. The commerce minister has indicated that this is just step one, and, that there will be more steps like the current one.

Here are some measures that the government proposes to take:

  1. Reduce taxes: The government will reduce Value Added Tax (VAT) by 4% on all products except for petroleum.
  2. Reduce Petrol and Diesel Prices: The prices of petrol and diesel are set by the state in India, and, are heavily subsidized. The government will slash petrol prices by 6% and diesel by 10%.
  3. Credit window for small businesses: The Small Industries Development Bank of India (SIDBI) will open up a credit window worth $1.5 billion for small businesses within the country.
  4. Government to issue tax free bonds worth $2 billion: The government is going to issue tax free bonds worth $2 billion and then use that money to fund infrastructure projects.

India has got a massive deficit of 10% and although inflation is currently low (relatively) at 8%, it was as high as 12% in October.

A combination of these two factors limit the extent to which the government can provide a boost to the economy. The industry is clearly not happy with the current package and has expressed that it is not enough. The billion dollar question, however, is – how much more can India afford?

Ways to tell the market is bottoming out

No one can predict the top or bottom of a stock market, or in fact any other market. But, there are a couple of interesting ways that generally indicate the bottom pretty well.

A good thing about these indicators is that they have nothing to do with technical analysis or numbers, instead, they focus on how people behave.

1. Market goes up on bad news: Jim Rogers talks about this a lot, and he says – when the market goes up, even, on bad news – that is a good indicator that the bottom is close.

This is exactly what happened on Friday 5th December 08, when, the unemployment numbers for November 2008 were announced in the US. The economy lost 544,000 jobs in a single month, and it was the worst month since December 1974. But the stock market went up that day – Dow, up 3% to close at 8,635 and Nasdaq, up 4.4% to close at 1509.

Since we are still in the middle of the current market fall, it is too early to say whether the market has bottomed out or not. But, we will know the answer in the next few months.

2. People don’t want to talk about the stock market. In his book – One Up On Wall Street – Peter Lynch presents his “Cocktail Theory”. A part of the theory is that – when the market has been down for a while, and no one is talking about stocks – that is a pretty good indicator that the market has reached its bottom.

He takes a very witty example, and says that when people would rather talk to dentists about plaque, than, talk to him about stocks – that’s a good sign that the market is reaching a bottom.

This is also true of the current market. People, today, will much rather talk about plaque than stocks.

Both the indicators point to a bottom, but only time will tell, whether these indicators were correct or not.

What is securities transaction tax?

Securities Transaction Tax (STT) was introduced in India a few years ago, to circumvent the tax avoidance of capital gains tax.

The government can only tax those profits, which have been declared by people. A lot of people simply didn’t declare their profits and avoided paying any capital gains tax.

To circumvent this situation, the Finance Minister at that time Mr. P Chidambaram introduced the Securities Transaction Tax. This tax is payable whether you buy or sell a share and gets added to the price during the transaction itself.

Since brokers have to automatically add this tax to the transaction price, there is no way to avoid it. If you place a limit order, then the broker will automatically adjust their brokerage and the Securities Transaction Tax and give you a price that matches your price. So, in a lot of cases; you will not even notice the tax that you paid. The flip side is that you end up paying this tax even if you have not made any gains at all.

What is Securities Transaction Tax rate?

In case of buying or selling stocks or equity oriented mutual funds, the STT is 0.125% of the total transaction value. This is what most people end up paying and this rate applies for stocks that you will take delivery of.

In case of squaring off daily positions or not taking delivery, the STT is 0.025%.

In case of derivatives, the tax is only on the seller and is calculated at 0.017%.

Deductions

At the end of the year, you can ask your broker to give you a certificate of the STT that you have paid through the year. You can use this amount to deduct from your short term capital gains and get a tax credit.

Buy and hold. And sell?

The Buy and Hold strategy is one, that gets beaten a lot in bear markets. There are good reasons for this beating and we will get to that. But, first let us look at what buy and hold means.

This strategy involves buying an index fund and then holding it for a long period of time. This is called Passive Investing and passive investors believe that the best way to earn steady returns is to buy funds at regular intervals and hold them for a long period of time.

Proponents of buy and hold say that active stock management leads to moderate returns, which are not worth the time spent in research or the commissions paid in frequently buying and selling stocks.

The trouble with Holding on

The big trouble with this strategy is that one big slide in the market kills all gains that you have made for a long time, sometimes as long as ten years!

If you bought the S&P 500 eleven years ago and held on to it, you would lose about 6% of your investment. On Dec 05, 1997, the S&P 500 was  983.79 and on Nov 28th, 2008 it was 896.24.

A look at the above chart tells you that you were in a similar situation at least once during the 2000 meltdown, so this is not a one-off situation. Similar conditions have occurred before also and since bubbles and busts are the nature of stock markets, they will continue to occur in the future also.

Don’t forget to sell

Calling a market top is almost impossible, but it is fairly easy to see when markets over-heat. Instead of holding on to stocks perennially, you should sell, when the market is over-heated. There is no reason to not do this.

When stock prices reach levels that do not justify the earnings of the companies they represent, there is no reason to hold on to the stocks. You should convert your stocks into cash in such times.

Don’t buy and sell all the time

This is not to say that one should buy and sell all the time. If you buy and sell all the time, then you will never make any money.

Money will still be made, when you buy and hold for a long time, but you should also sell when the market overheats. Book profits, while there is still time, because every boom will be followed by a bust.