Welcome back to last year

RBI released the Mid Quarter Monetary Policy review last week, and it reminded me of the mid year review done about a year ago. By now you know that the Repo rate has been increased to 8.25%, and that the RBI is still worried about the high inflation, and has raised the rates to continue with their stance earlier.

You probably also remember the troika that was talked about in the last review that could adversely affect the growth or inflation situation.

These were:

  1. Bad Monsoon
  2. Commodity Bubble or Collapse
  3. Eurozone debt crisis assuming a full blown proportion

What’s interesting is that out of these three factors – bad monsoons are the only ones that have spared us. We have had a good monsoon, and record food production is expected this year, but at the same time food inflation is close to double digits (as the report puts it).

What’s more, we are not coming off a low base, these numbers have been high for quite some time, and food prices have just gone north for quite some time now.

Why aren’t prices moderating then? Perhaps reading something from the second quarter review LAST year will throw some light on it.

Further, notwithstanding some moderation, food price inflation has remained persistently elevated for over a year now, reflecting in part the structural demand-supply mismatches in several commodities – besides protein sources, oilseeds and vegetables also show this pattern. Given the changing consumption patterns and as yet inadequate supply response, food price inflation is becoming increasingly structural in nature. Further, even as non-food manufacturing inflation has indeed moderated, it still remains above its medium-term trend.

Now look at an excerpt from one year later:

Food inflation is at near-double digit levels, despite normal monsoons, underlining the fact that it is being driven by structural demand- supply imbalances and cannot be dismissed as a temporary phenomenon.

Isn’t it incredible?

Imagine what would happen if the monsoons were bad.

Till last year food inflation was the number one worry, but that has changed into more “generalized inflation” this year, and this is not helping anyone.

Unfortunately, the global recovery has sputtered, the situation in Europe is still very unclear, and crude prices rose (before they fell) making the situation worse this year.

But the food situation is depressing because it is so well documented, and has been talked about for such a long time, and still no progress have been made on it. I wonder if we will still be seeing the same thing one year down the road.

Donkey ambulances, powerful cities and twin suns

This week I read a very interesting story about the potential use of donkey ambulances in Afghanistan, and the story touched upon how people in rich countries donate stuff to under developed countries that aren’t really suitable for them, and despite all good intentions – the efforts and money go waste. There are several inexpensive examples of useful technology in the article, and I loved some of the innovative thinking talked about there.

Next up, this slideshow of the 25 economically most powerful cities in the world. You would have guessed either Tokyo or New York to be top, and you would have been correct, you would have expected a healthy sprinkling of Chinese cities and you would have been correct there too, but you probably wouldn’t have thought Seoul is number 10 and there’s not even a single Indian city in there.

By now you have probably read of the discovery of the planet with two suns, and also of the popular Star Wars image the discovery evokes. Brilliant and beautiful.

Back on earth, Hemant writes about 15 kinds of risk you could face in your investment, CA club writes about reverse mortgages, and Roger Nusbaum contemplates how many funds should a portfolio have.

And finally, here is something relevant with the recent petrol price hikes.

Enjoy your weekend!

IFCI Tier II Series 3 NCD Details

Sahil left a comment about IFCI coming out with another series of their Tier II bonds, and I was completely unaware about this. I searched a little more but couldn’t find anything other than the application form on the Bajaj Capital website.

I’m a bit surprised by that because usually these are easier to locate but this time the documents aren’t even present on the IFCI website.

From the application form I could gather that the issue has already opened on 5th September 2011, and will close on October 10th, 2011.

There are four options in all – two maturities, and a cumulative and annual interest payment option on each maturity option.

Here are the interest rate and other details for the four options.

Option I II III IV
Face Value 10,000 10,000 10,000 10,000
Coupon Rate 10.60% 10.60% 10.50% 10.75%
Interest Payment Cumulative Annual Annual Annual
Duration 10 years 10 years 10 years 15 years
Eligibility Retail under 5 lakhs Retail under 5 lakhs All eligible investors All eligible investors
Call Option At the end of 7 years At the end of 7 years At the end of 7 years At the end of 10 years
Redemption Amount 27,388 10,000 10,000 10,000

Like the earlier series, even these Tier II Series 3 NCDs will be unsecured, and will list on the BSE.

The last series that were issued by them also had some very similar features with the 7-year series giving a rate of 10.50%, and the 10-year series giving an interest rate of 10.75%.

I see that the listed NCD 10.5% series closed at Rs. 9,850 yesterday, and this series is quite similar to that one. So if you were interested in these bonds you could just buy the existing bonds from the market and avoid the hassle of waiting for the issue to close, and then get allotment.

And it might even make sense to wait and see what happens when these bonds list on the market and increase the supply – the price may go down even further.

And one last thing about IFCI itself – I’ve seen several people refer to it as a government company right from the time they issued the infrastructure bonds last year, but this is not true. The central or state government doesn’t own any stake in IFCI.

This is what the shareholding pattern looks like

Mutual Funds / UTI 1.07%
Financial Institutions / Banks 13.89%
Insurance Companies 14.39%
FIIs 20.97%
Bodies Corporate 10.70%
Individuals 30.76%
Individuals holding more than Rs. 1 lakh 7.12%
NRIs 1.08%

If I get the prospectus – I’ll go through it and see if there’s any more pertinent information there, and update the post then.

Manappuram NCD lists at a discount

Manappuram NCD listed yesterday, and the 2 year series went as low as Rs. 950 before closing at Rs. 973.

This is the second NCD that has listed at a discount (after India Infoline Investment Services Ltd.), and that too despite the fact that it had a good coupon rate of 12.20%.

Both these NCDs now have at least one series that trades at a yield of over 13.5%, and that’s better than the yield that’s going to be offered by Religare Finvest NCD which is the next one in line.

This is certainly quite an attractive yield, and in the case of IIIFL you can lock it for 5 years whereas in the case of Manappuram the tenure is 2 years.

The market movements show that you could potentially get these NCDs at an even cheaper price and that makes the yield even more attractive.

Here is a list of the series of Manappuram and IIIFL NCDs along with their price and YTMs. YTM data is approximate and I’ve calculated it from MoneyChimp. I’m trying to get a better source to get the YTM numbers where I can enter the exact time remaining and get an answer.


Name Coupon Scrip Code / ISIN Scrip Id Price Yield to Maturity
MFL – NCD1- ZERO COUPON


Zero Coupon

400 days

934826 MFLNCD1 1,000 12.00%
MFL – NCD2-12.00% SEMI ANNUAL


12.00% Semi Annual

24 months

934827 MFLNCD2
MFL – NCD3-12.20% SEMI ANNUAL


12.20% Semi Annual

24 months

934828 MFLNCD3 973.99 13.84%
India Infoline Investment Services Limited 11.70%

36 months

INE866I07206 IIISL N1 980 12.54%
India Infoline Investment Services Limited 11.70%

40 months

INE866I07214 IIISL N2 980 12.54%
India Infoline Investment Services Limited 11.70%

60 months

INE866I07222 IIISL N3 960 12.83%
India Infoline Investment Services Limited 11.90%

60 months

INE866I07230 IIISL N4 937 13.72%

This space is definitely getting interesting, and while the risk of investing in smaller NBFCs is higher than investing in banks it’s hard to ignore these yields either.

Manappuram promoters have taken a loan against pledged shares which is a big red flag for me, and IIISL have large sums loaned out against shares which are volatile and that makes me stay away from that as well. So, there are reasons why SBI NCDs, or even STFC NCDs trade at a premium and these trade at a discount, and I would like to wait and watch to see if Religare NCD lists at a premium or discount.

When something appears a bit too good – I’m always concerned if the market knows something that I don’t and right now this falls under that category.

Excerpts from Future Babble

I’m currently reading a very good book on how future predictions are wrong most of the times, and the author is not only talking about stock predictions, but predictions of all kinds from food shortages to oil prices to how long a war will last.

Future Babble is written by Dan Gardner and deals with how expert predictions are wrong most of the times, and how you can do better yourself.

I’m not yet done reading the book and haven’t reached the how you can do better yourself section yet, but I did want to share some particularly entertaining snippets from the book, and highlight one point that came to my mind again and again.

First, let’s look at an economic collapse prediction thankfully gone wrong:

A small library could be filled with books predicting stock market crashes and economic disasters that never happened, but the giant of the genre was published in 1987. The hardcover edition of economist Ravi Batra’s The Great Depression of 1990 hit the top spot on The New York Times best-seller list and spent a total of ten months on the chart; the paperback stayed on the list for an astonishing nineteen months. When the American economy slipped into recession in 1990, Batra looked prophetic. When the recession proved to be mild and brief, he seemed less so. When the 1990s roared, he looked foolish, particularly when he spent the entire decade writing books predicting a depression was imminent.

Next a Nobel winning economist getting it wrong:

Even economists who win Nobel Prizes have been known to blow big calls. In 1997, as Asian economies struggled with a major currency crisis, Paul Krugman—New York Times columnist and winner of the Nobel Prize in 2008—worried that Asia must act quickly. If not, he wrote in Fortune magazine, “we could be looking at a true Depression scenario—the kind of slump that sixty years ago devastated societies, destabilized governments, and eventually led to war.” Krugman’s prescription? Currency controls. It had to be done or else. But mostly, it wasn’t done. And Asia was booming again within two years.

Finally, a funny one about the stock market prediction.

Another bull market, this one in the late 1990s, produced a bookshelf full of predictions so giddy they made Irving Fisher sound like Eeyore. The most famous was the 1999 book Dow 36,000 by James Glassman and Kevin Hassett. “If you are worried about missing the market’s big move upward, you will discover that it’s not too late,” Glassman and Hassett wrote. Actually, it was too late. Shortly after Dow 36,000 was published, the Dow peaked at less than 12,000 and started a long, painful descent.

The point I’d like to make about this is how some people get all worked up and excited after they read an article on a particular subject, and form an opinion on something just by listening to one person, or reading one or two articles on a topic.

I come across a lot of arguments in the nature of it must be right because an authority on the subject said so.

I think people fail to see that for almost every topic, you will have many smart people take one side, and as many smart people take another.

At the very least you need to dig a little deeper and see if the argument that the person is making appeals to you, and then acknowledge that there is room for error. I once jokingly told a friend who used to idolize George Soros that you are buying gold while Soros is selling it, and he said “but he is just one man”.

I really liked that line – he is just one man and you are looking at just one of his ideas – he is not god and can be wrong.

If my argument is just that one man is betting against your idea then I don’t have an argument at all.

This ties in to coat tail investing as well where investors see what big players are buying and then go ahead and buy that same stock.

I think looking at what big investors are buying is a great source of screening stocks, but that doesn’t make it infallible. The stock can still go down, and if you buy too much of it you are still taking a risk. You must still be cognizant of that risk, and not go all in with your purchase.

The next time you get all worked up reading an article – take a deep breath and say to yourself – but it’s just one person!

Also read Who should you listen to?

Disclaimer: Amazon link is affiliate.

Of Snail Houses and Naked Marriages

There was a lot of spirited discussion about owning a house in the comment thread of my post on equities, gold, and real estate, and it also reminded me that the real estate sector in India is nowhere as hot as it is in China.

I feel that way due to mostly anecdotal evidence and the many weird real estate related stories that come out of China periodically.

The last one I read was about a phenomenon described as naked marriage or luohun. Now before you say there better be pictures, be advised that it has nothing to do with clothes!

Naked marriage is a term given to marriages in China that are done without spending much on the occasion itself, and before the guy owns a house, a car, or has a big bank balance.

In fact the story I linked to describes one couple whose only expense on marriage was 100 yuan which was the cost of a small dinner party.

Naked marriages are a response to rising real estate prices, and high cost of living in the cities, that’s making it difficult for Chinese couples to own a lot of assets before they get married and apparently they are becoming left – over singles.

There is even a TV show on the phenomenon called The Era of Naked Marriages, and that seemed to have struck a real chord with people because the first episode topped all ratings.

Another TV show which became quite popular in 2009 was “Wo Ju” which literally translates to Snail House.

The show was about a young couple trying to find affordable housing in China, and the story is actually quite emotional, with the couple finding it hard to buy a house with prices skyrocketing, and the wife’s younger sister coming to live with them who then gets involved with a government official who helps them with money to buy the house.

It’s incredible that a TV show about housing prices became so popular, but what truly amazed me was the fact that the government canceled the TV show! Imagine that!

How close does it have to be to reality for the government to get so unsettled as to cancel a TV show?

And of course, there was a jaw – dropping story I read in Time about a person who drives a taxi (must be his own) and was going to buy a house worth $735,000!

The government gave him some compensation for his house 8 years ago when they acquired it for redevelopment, and since then he has managed to own 3 apartments.

There is of course a lot written about the Chinese real estate bubble, and most of it is data driven like the estimate about 64 million empty apartments in the country, and I have been reading these type of things for quite long now so who knows when it will pop, but it sure looks like a familiar story.

I don’t think Indian real estate sector is anywhere close to this kind of over heating, but who knows, we might be headed that way as well.

Leading Indian Indices and their Performance Details

This is another post from the Suggest a Topic page, and today we are going to look at the performance of some of the leading indices in India – their performance, as well as how they are constructed.

The post was triggered by the idea to see if one type of index is better than another, and if it is harder to beat one type of index than another.

My take on both of these questions is no, and here’s why.

For the first question – that of one index being better than another – most modern Indices are constructed using very similar methodology, and certainly all leading indices in India are constructed using more or less the same methodology, and that’s the free float market capitalization method.

So, there is not much by way of index construction that sets one apart from the other. But you will be surprised to know that one of the most popular indices in the world – the Dow Jones Industrial Average is not built using this modern method, and instead is a price weighted index.

This means that the price of the stocks determine how much weight it holds in the index rather than the market capitalization of the stock!

Then, the constituents of the index are determined by the editors of WSJ, and they have discretion to choose and leave out stocks!

Doesn’t this sound all too flawed?

But there is a great Stanford paper that critically examines the index against data from the past and comes up with astonishing results. In the paper the researchers find that even if the DJIA was constructed using some of the more modern methods the results wouldn’t be much different.

I have a full post on this subject here called Mythbusting the Dow, and I definitely recommend it.

The second question is if one type of index is harder to beat than another, and I don’t see how that can be possible.

I can see random walkers say that passive investing is always better than active investing, and while I don’t subscribe to that view, I can certainly see why they say that.

But on what basis do you say that one index is harder to beat than another? I fail to see the sense in that.

Now, let’s look at the numbers, and see what that show us. For this exercise I have taken all the major Indices based on the Sensex and Nifty, and looked at their returns for 4 periods.

1. Year To Date.

2. 3 Year till Jan 2011

3. 5 Year till Jan 2011

4. 10 Year till Jan 2011.

I took calendar years so that I can update this information easily later on, and compare it across other years.

Here are the results of that exercise.

YTD 3 Year Till Jan 2011 5 Years Till Jan 2011 10 Years till Jan 2011
Nifty -17.52% 0.90% 116.27% 390.87%
Sensex -18.21% 1.46% 118.86% 416.82%
Nifty Junior -16.62% -1.08% 120.74% 406.86%
CNX 100 -17.37% 0.75% 88.00% No Records
BSE 100 -17.60% -4.14% 116.02% 425.12%
BSE 200 -17.85% -4.54% 114.06% 479.27%
CNX 500 -17.06% -6.50% 100.92% 444.12%
BSE 500 -17.61% -7.32% 110.07% 509.85%
Nifty Midcap -24.19% -22.23% 62.33% No Records
BSE Midcap -17.52% -20.57% 76.24% No Records
Nifty Smallcap -16.53% -30.71% 84.90% No Records
BSE Smallcap -24.47% -28.11% 62.28% No Records

This is great data and shows that the performance of large caps has been much better than that of mid and small caps, and that’s mainly attributable to the fact that when the market goes down, the small and mid caps go down a lot more than the large caps, but they don’t bounce back with that great a vengeance.

You can observe that by going across the 3 year return column and seeing how much bigger the negative numbers are at the bottom compared to the top where the indices based on large caps are.

To me, that’s the single most important thing that emerges from this comparison – large caps have done better than small and mid caps in the past and if I were to go the index route, I would certainly prefer to own indexes on large caps or broad based indices rather than bet on small and mid cap stocks.

This is not only true because of the performance, but also because of the generally better corporate governance in large caps, increased liquidity, and the fact that most of our market is concentrated in a few very large companies.

So, the way I would approach this is to select a universe of stocks that I am interested in investing and then choose a low cost, high volume index provider on that universe.

Also, I didn’t see a list of consolidated indices and the explanation of their methodology, so I compiled one myself with data from NSE and BSE, and this will give you a snapshot on understanding what the various indices are and how they are constructed.


S.No. Name Description Number of shares
1 BSE Sensex This contains the 30 largest Indian companies on the basis of their free float market capitalization. 30
2 S&P CNX Nifty This contains 50 of the largest Indian companies belonging to 23 sectors. 50
3 CNX Nifty Junior The next rung of liquid securities after S&P CNX Nifty is the CNX Nifty Junior. It may be useful to think of the S&P CNX Nifty and the CNX Nifty Junior as making up the 100 most liquid stocks in India. 50
4 S&P CNX 100 CNX 100 index would comprise of the securities, which are constituents of S&P CNX Nifty, and CNX Nifty Junior 100
5 S&P CNX DEFTY S&P CNX Defty is S&P CNX Nifty, measured in dollars. 50
6 S&P CNX 500 The S&P CNX 500 is India’s first broad based benchmark of the Indian capital market. The S&P CNX 500 represents about 94.92% of the Free Float Market Capitalization and about 91.68% of the total turnover on the NSE as on June 30, 2011. 500
7 BSE 100 A broad-based index, the BSE-100 was formerly known as the BSE National index.  This Index has 1983-84 as the base year and was launched in 1989.  In line with the shift of the BSE Indices to the globally accepted Free-Float methodology, BSE-100 was shifted to Free-Float methodology effective from April 5, 2004.  The method of computation of Free-Float index and determination of free-float factors is similar to the methodology for SENSEX.  100
8 BSE 200 The equity shares of 200 selected companies from the specified and non-specified lists of BSE were considered for inclusion in the sample for `BSE-200′. The selection of companies was primarily been done on the basis of current market capitalization of the listed scrips. Moreover, the market activity of the companies as reflected by the volumes of turnover and certain fundamental factors were considered for the final selection of the 200 companies. 200
9 BSE 500 BSE-500 index represents nearly 93% of the total market capitalization on BSE. BSE-500 covers all 20 major industries of the economy. In line with other BSE indices, effective August 16, 2005 calculation methodology was shifted to the free-float methodology. 500
10 BSE Midcap The general guidelines for selection of constituents in BSE Mid-Cap & BSE Small-Cap Index are as follows:Trading Frequency:

1. The scrip should have been traded on 60% of the trading days in the last three months

2. Eligible universe shall comprise of companies aggregating 98.5% of average market capitalization

3. This list shall be categorized under large-cap, mid-cap and small-cap segment based on 80%-15%-5% market capitalization coverage respectively

4. BSE Mid-Cap Index shall comprise of scrips that gives market capitalization coverage between 80% & 95% from the list derived as per point no.3 above

5. BSE Small-Cap Index shall comprise of scrips that gives market capitalization coverage between 95% & 100% from the list derived as per pont no.3 above

6. Quarterly review of these indices shall be carried out as per the above criteria subject to a buffer of 3%


Variable
11 BSE Small Cap See above Variable
12 Nifty Midcap 50 The constituents and the criteria for the selection judge the effectiveness of the index. Selection of the index set is, inter alia, based on the following criteria:Stocks with average market capitalization ranging from Rs.1000 Crore to Rs.5000 Crore at the time of selection.


Stocks which are not part of the derivatives segment are excluded.


Stocks which are forming part of the S&P CNX NIFTY index are excluded.


50
13 Nifty Smallcap The criteria for the CNX Smallcap Index include the following:

  1. All the companies that are listed on NSE, which individually constitute more than 5% free-float market capitalization of the universe, shall be excluded in order to reduce the skewness in the weightage of the companies in the universe.
  2. After step (a), the weightage of the remaining companies in the universe will be determined again.
  3. After step (b), the cumulative weightage will be calculated.
  4. After step (c), companies which form part of the cumulative percentage in ascending order upto the first 90 percent (i.e. up to 89.99 percent) of the revised universe shall be excluded.
  5. After step (d), companies within the range of 90th to 95th percentile shall be ranked in the descending order of aggregate turnover for the last six months.
  6. After step (e), the top 100 companies shall constitute the CNX Smallcap Index subject to fulfilment of the following additional criteria:
  1. The company must have a 3 years’ track record of operations with positive net worth.
  2. All constituents of the CNX Smallcap Index must have a minimum listing record of 6 months.
    1. Companies must have demonstrated a trading frequency of at least 90 % in the last six months
  1. The review will be carried out on a semi-annual basis.


100

As always, comments and questions welcome!

Solar Charkhas, Informational Society and Paid News

I’ll start this post with one of the most thought provoking things I read this week. Fred Wilson is one of the leading VCs in the US, and he wrote a post titled What is going on? on Monday and gave a brief and hard hitting explanation on what’s wrong with the economy in the US, and why aren’t there more jobs being created there.

Although the post is written from a US perspective, what he describes is applicable to every single country in the world.

The first point is about entitlements in a system that make the costs so huge that it makes it impossible for the company or even the industry to operate profitably. I’ll come back to this point later in this post because it ties to something that may happen soon.

The second point is about the transformation of the current system from an industrial society to an informational society. I’ve written earlier how India moved from agriculture to services, and missed the industrial phase in between which is what almost all economies go through, but it’s the first time that it’s occurred to me that it’s probably because of the times we are in, and may not even be needed for India. I’ve always thought that until there is a strong manufacturing base, the millions below the digital divide can never be brought up to par, but maybe that’s not needed in the 21st century?

Getting back to the first point about entitlements – Ajay Shah wrote a post this week titled Reversal of Reforms in NPS? about the possibility of making the NPS a guaranteed returns scheme – this ties back amazingly well to Fred Wilson’s point about having systems that have such high inherent costs that they can never be profitable.

Making the NPS a guaranteed returns scheme is a bad idea, and this Mint Editorial does a great job at explaining why.

So in fact India may be creating a problem that US is currently dealing with!

On to personal finance – Hemant discusses 10 financial planning rules of thumb.

The Hoot on paid news in the Times of India. Apparently, TOI doesn’t mind republishing an entire story from 2008 without any updates if they have a fine print disclaimer telling you that it is from 2008!

BusinessWeek on how a Pakistani tech whiz has created a supremely useful service that can send a text message to thousands of people at one go. It’s a simple technology that’s relevant and useful to their situation today.

Finally, PIB reports that Khadi and Village Industries Commission in collaboration with Gandhi Gramodyog Urja Vikas Sanstha has developed Solar Charkhas.

Enjoy your weekend!

Introduction to NCDs – Part III

This is part 3 of the series on introduction to NCDs, and this post will primarily focus on listing of bonds and aspects related to it.

To read the first two posts of the series you can go here:

1. Introduction to NCDs – Part I

2. Introduction to NCDs – Part II

What does listing of an NCD mean?

Listing of NCD means that a few weeks after the bond has been allotted to you it starts trading in the stock exchange. They trade like any other stock, and you can buy and sell them from the stock exchange at that time.

Since they are trading on the exchange, the price varies from time to time, and a bond that had a face value of Rs. 1,000 can be trading for Rs. 920, or even be trading at Rs. 1,100. If an NCD trades below its face value it’s said to be trading at a discount, and if it trades above its face value – it’s said to be trading at a premium.

How does this affect interest payment?

The price at which you buy the bond doesn’t affect the interest payment. Regardless of what you pay for the bond, you will get the interest rate promised by the issuer on the face value of the bond. So, if the issuer said they are going to pay 9% on Rs. 1,000 bond – you will get Rs. 90 (updated) regardless of what price you pay for the bond.

This does however affect yield which is what we will come to next.

What is yield and how can I look at different NCD yields?

The price of listed bonds fluctuate with demand and supply, and the demand for a bond depends on the interest rate on that bond and the quality of the issuer.

We have seen rising interest rates in the past few months, and the bonds that came out earlier had a lower coupon rate than the bonds that are coming out now. If the quality of both their issuers is the same then there is no reason to buy the bond at a lower coupon rate (since the bond at a higher coupon rate is available).

Generally, there are two types of yields associated with bonds – Current Yield and Yield to Maturity.

The current yield tells you what’s the effective rate of interest you will get when you buy the bond at the market price. So, a bond with a face value of Rs. 100, and rate of interest of 9% will have a yield of 9% when the bond is first issued, but if the bond starts trading at Rs. 90 in the market then your yield becomes 10%, since you get Rs. 9 interest on your investment of Rs. 90.

Since you are buying the bonds at a discount, you get additional income when you redeem them at face value, so you will get Rs. 100 for a bond that you bought for only Rs. 90, and that also adds to your yield.

The Yield To Maturity calculation takes this into account as well, and that’s the second type of yield normally associated with bonds.

I have done two fairly detailed posts on how bond yields are calculated , and you can read those posts to understand this concept better. They were written for tax saving infrastructure bonds which will be issued later in the year, so the context is slightly different but the main concept is the same.

As to the question of where you can find yields – unfortunately, there is no way that you can do that right now. Their list is not available at any website right now.

However, I am working on a partial list that will contain the data from the recent NCDs and I will keep updating them every couple of months or so like my best fixed deposit interest rates. That post will be published either later this week or early next week.

If you want to find yields quickly then MoneyChimp has an excellent bond yield calculator on their site.

Is there interest rate the only factor that affects price and yield of a bond?

Interest rate is a big factor but that’s not the only factor – the quality of issuer is an important factor as well. That’s why the recently issued NCDs by India Infoline Investment Services Ltd. is trading at a discount while the SBI bonds issued earlier are trading at a premium despite the fact that the coupon rate on the IIIFL NCD is higher than the coupon rate on the SBI bonds.

There is a little bit of speculative element on the prices of NCDs as well since they are trading on a stock exchange, and a lot of people who buy them aren’t buying them for interest income but rather sell them to someone else for capital gains, and that introduces some bit of volatility in the bond prices.

For instance, the IIIFL bonds were listed at a discount of 8% which is quite huge for a fixed income offer, but then recovered and though still trading at a discount it’s not as big as 8% .

There was a question on why someone should apply for them when you can get them at a discount, and that’s because you don’t know before hand that something will trade at a discount or not. For all you know – the issue may list at a premium after listing. So, there is no guarantee either way.

Summary

To summarize, NCDs trade on the stock exchange, and you can buy and sell them from the exchange, so you are not restricted to when the issue opens, or when the bonds mature.

Since you buy them from the exchange – you may have to pay a premium or get a discount based on the market conditions at the time. This doesn’t affect how much interest you get paid annually, but does depend your yield. In simple terms – yield is the effective interest rate you get calculated based on the price of the bond, and the coupon rate.

Currently, the yield and other details are not consolidated at a single place, though that will improve with time.

The next post in this series will contain the details of all the currently listed bonds, and their current yields etc.

Religare Finvest NCD Review

The latest company to come out with a NCD is Religare Finvest, and this is the fully owned subsidiary of Religare.

The NCD opens for subscription on the 9th September 2011, and closes on the September 26th 2011. The Religare NCD is going to give 12.5% for 5 years which is the maximum that any NCD has offered yet. They plan to raise Rs. 8 billion from this issue. The issue has been raised ICRA AA- (stable) by ICRA and Care AA- by CARE. These ratings indicate a high degree of safety regarding timely servicing of financial obligations and carrying low credit risk meaning they are very likely to pay interest on time, and unlikely to default on their debt.

The company has a gross loan portfolio of Rs. 79,346.21 million and 91% of that is backed by collateral. The company has grown at a very high rate in the past few years growing from a loan book of Rs 5.66 billion in 2007 to a loan book for Rs. 89.6 billion last year.

The total income grew from Rs. 973.25 million to Rs. 11,631.50 million in the same period. So the loan book grew at a CAGR of 73.75% and income by 64.24%.

The one thing that has lowered during this time is the Capital Adequacy Ratio which was 64.27% in 2009, 21.67% in 2010, and is down to 16.16% in 2011. I think this is one of the lower ones seen when compared with the other NCDs that have been recently issued.

Religare Finvest caters to the Small and Medium Enterprises as well as the retail segment for its business, but the biggest segment of its loan book is the loan against properties it gives out to the small and medium enterprises.

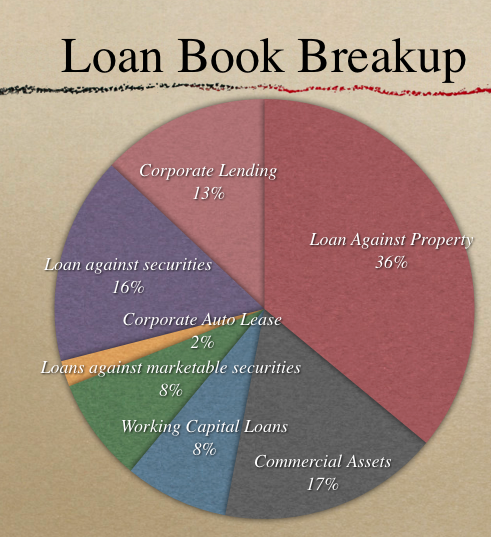
Here is the breakup in its loan book as on June 30 2011.

  • SME Financing: Loan Against Property 36
  • SME Financing: Commercial Assets 17
  • SME Financing: Working Capital Loans 8
  • SME Financing: Loans against marketable securities 8
  • Corporate Auto Lease 2
  • Retail Capital Market Finance: Loan against securities 16
  • Corporate Lending 13
Religare Finvest Loan Book

If you look at this mix then this seems to be a lot better than the other NCDs we’ve seen before. Mannapuram was of course all gold, India Infoline had a lot of real estate and stocks, and Shriram City Union had more than a quarter in gold, and 9% in personal loans as well.  On the other hand, Religare Finvest’s Capital Adequacy Ratio at 16.16% is lower than the other companies we have seen come out with NCDs.

Now let’s take a look at the terms of the issue itself.

Terms of the Religare Finvest NCD

The minimum investment required is Rs. 10,000 and the issue opens from September 9th 2011 and closes on September 26th 2011.

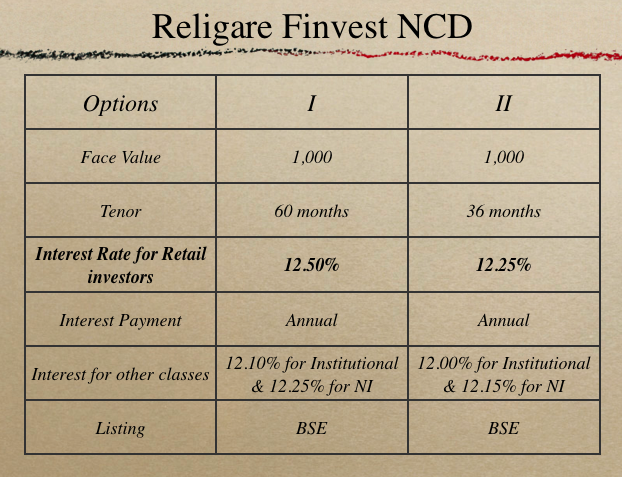
There are two series – one for 3 years, and the other one for 5 years, and both of them pay interest annually. The interest rate for retail investors is 12.50% for the 5 year series which is the highest coupon rate any NCD has offered yet. Here are the other details.

Religare Finvest NCD Terms of the Issue

There are bound to be questions on whether there will be listing gains or not, and I’m 100% confident that I have absolutely no clue about it. But I do have a feeling that the retail part will be over subscribed so if you do decide to invest in them it will be a good idea to apply quickly, as the NCDs will be offered first come first serve basis.

When they do list, there will be six NCDs listing on the exchange, one for each maturity and coupon rate, and you can decide which one you want to buy at that time as well.

Those are some key things that caught my eye while going through the prospectus of this issue, and as always,  questions and comments are welcome!

If you are a new reader and have some basic questions about NCDs then you will find these two posts about NCDs useful: 

Introduction to NCDs Part I

Introduction to NCDs Part II