ICICI Bank b2 branchfree banking

Karthik left a comment about ICICI’s b2 branchfree banking the other day, and that was the first time I learned about this savings account from ICICI bank.

I asked a few people who I thought might have had personal experience with this but they didn’t and neither did they know anyone who did, and looking at ICICI’s website – it doesn’t look like this product does very well and I wonder if they still allow people to open this type of account. I think as you dig deep it’s easy to see why this never caught on so let’s look at some things about this account.

Branch Free Banking

First a little bit about b2 branchfree banking itself. The concept is very simple – you open a savings account which is not associated with any branch, and this account has no balance requirements or in other words it is a zero balance account.

Zero Balance Account

According to ICICI Bank, the two big benefits of this account are that you can have a zero balance account and you can get some extra earnings on this account since this is a low cost account for the bank.

I don’t know how appealing a zero balance account is for most people since a lot of salary accounts are zero balance accounts, and even if they are not – it is usually not a problem to keep Rs. 5,000 – Rs. 15,000 in a savings account.

Auto Sweep Feature

The second aspect of it – which is earning a bit of extra returns certainly makes you stop and investigate more. From what I could gather on their site – the extra earnings accrue because they have an auto sweep feature in the b2 branchless bank account. This works exactly like other auto sweep features where they will move a certain amount from savings account to your fixed deposit and then that will earn a higher rate of interest than the savings account. You can withdraw this money any time and in that sense it is not blocked in the fixed deposit.

No Branch Access or Checkbook

Since this is an online account you don’t get any access to a branch meaning you can’t go to a bank branch for anything and you don’t get a check book either. You can create a draft online which will be couriered to your house and they will charge you Rs. 15 for it. As far as I can see there are no other charges for creating a draft.

No ATM Card

You don’t get an ATM card with this account either and that to me severely limits what you can use the account for. You can only pay bills online using this account or use the Auto Sweep facility, and that’s about it.

That’s not really a lot when you consider that you can pay bills online easily with your other accounts, and if you really did want to benefit from high rates of interest on savings account you are probably better off utilizing a bank such as Yes Bank or Kotak bank.

I find it hard to get excited about this concept with whatever information I could get it and I would certainly like to hear from someone who has opened the account and how it benefited them.

Finally, one odd thing about this branchless banking is that you can only open it if you are resident of one of these cities. Now what sense does that make? You don’t have access to a bank branch, but you need to be resident of a particular city?

Here is a MouthShut review of  the b2 branchless bank account that Karthik left a link to that you may find useful.

This post was from the Suggest a Topic page.

How to calculate interest on recurring deposits?

Pradeep Sharma left a comment the other day about how he had set up a recurring deposit with ICICI Bank and how the final amount he was calculating was different from the amount that the ICICI Bank representative told him.

That difference was due to the fact that while he was compounding interest monthly, banks usually compound interest quarterly and that’s why he was getting a different answer.

Paresh responded to that comment telling him what caused the difference, and when I looked at the response, I thought I’d add to it by providing a link to how interest on recurring deposits (RDs) are calculated.

I was surprised to see that while there were quite a few recurring deposit calculators, there were hardly any explanations and the few that existed were really very short explanations on how interest on RD was calculated.

So, I decided to give it a try myself, and it took me an embarrassingly long time and several mistakes to do that even though the concept is very simple.

Understand Compound Interest To Understand Recurring Deposit Interest

When you create a RD for Rs. 10,000 for 2 years, what you’re doing is depositing Rs. 10,000 with the bank every month for 24 months, and the bank pays you interest on Rs. 10,000 for 2 years compounding it quarterly, then for the next Rs. 10,000 it pays you interest for 23 months, and so on and so forth.

Banks usually compound interest quarterly, so the first thing is to look at the formula for compound interest.

That formula is as follows:

A formula for calculating annual compound interest is

A = P \left(1 + \frac{r}{n}\right)^{nt}

Where,

  • A = final amount
  • P = principal amount (initial investment)
  • r = annual nominal interest rate (as a decimal, not in percentage)
  • n = number of times the interest is compounded per year
  • t = number of years

In your recurring deposit, you use this formula to calculate the final amount with each installment, and at the end of the installments, you add them all up to get the final amount.

Think of RD Installments and Series of Principal Payments

Let’s take a simple example to understand this – suppose you start a recurring deposit for Rs. 47,000 per month for 2 years at 8.25% compounded quarterly. If you were to see this number as a standalone fixed deposit that you set up every month for 24 months, you could come up with a table like I have here. Before you get to the table, here is a brief explanation on the columns.

  • Month: First column is simply the Month.
  • Principal (P): Second column is P or principal investment which is going to be the same for 24 months,
  • Rate of Interest (r): r is going to 8.25% divided by 100.
  • 1+r/n: In our case, n is 4 since the interest is compounded quarterly, and 1+r/n is rate divided by compounding periods.
  • Months Remaining: This is simply how far away from 2 years you are because that’s how much time your money will grow for.
  • Months expressed in year: I’ve created a column for Months expressed in a year since that makes it easy to do the calculation in Excel.
  • nt: 4 multiplied by how many months are remaining as expressed in year.
  • (1+r/n)^nt: Rate of interest raised by the compounding factor.
  • Amount (A): Finally, this is the amount you if you plug in the numbers in a row in the compound interest formula.

So, Rs. 47000 compounded quarterly for 2 years at 8.25% will yield Rs. 55,338.51 after two years. The last row contains the grand total which is what the RD will yield at the end of the time period.

Month

P

r

1+r/n

Months remaining

Months expressed in year

nt

(1+r/n)^nt

A

1

47000

0.0825

1.020625

24

2

8.00

1.18

55338.51

2

47000

0.0825

1.020625

23

1.916666667

7.67

1.17

54963.21

3

47000

0.0825

1.020625

22

1.833333333

7.33

1.16

54590.45

4

47000

0.0825

1.020625

21

1.75

7.00

1.15

54220.22

5

47000

0.0825

1.020625

20

1.666666667

6.67

1.15

53852.50

6

47000

0.0825

1.020625

19

1.583333333

6.33

1.14

53487.27

7

47000

0.0825

1.020625

18

1.5

6.00

1.13

53124.53

8

47000

0.0825

1.020625

17

1.416666667

5.67

1.12

52764.24

9

47000

0.0825

1.020625

16

1.333333333

5.33

1.12

52406.39

10

47000

0.0825

1.020625

15

1.25

5.00

1.11

52050.97

11

47000

0.0825

1.020625

14

1.166666667

4.67

1.10

51697.97

12

47000

0.0825

1.020625

13

1.083333333

4.33

1.09

51347.35

13

47000

0.0825

1.020625

12

1

4.00

1.09

50999.12

14

47000

0.0825

1.020625

11

0.916666667

3.67

1.08

50653.24

15

47000

0.0825

1.020625

10

0.833333333

3.33

1.07

50309.72

16

47000

0.0825

1.020625

9

0.75

3.00

1.06

49968.52

17

47000

0.0825

1.020625

8

0.666666667

2.67

1.06

49629.63

18

47000

0.0825

1.020625

7

0.583333333

2.33

1.05

49293.05

19

47000

0.0825

1.020625

6

0.5

2.00

1.04

48958.74

20

47000

0.0825

1.020625

5

0.416666667

1.67

1.03

48626.71

21

47000

0.0825

1.020625

4

0.333333333

1.33

1.03

48296.92

22

47000

0.0825

1.020625

3

0.25

1.00

1.02

47969.38

23

47000

0.0825

1.020625

2

0.166666667

0.67

1.01

47644.05

24

47000

0.0825

1.020625

1

0.083333333

0.33

1.01

47320.93

Final Amount

12,29,514

I’ll be the first one to admit that this is not a very intuitive way to either explain or understand recurring deposits calculation, but this is the only way I could write which seemed to convey the calculation comprehensively.

If you have any questions or have links to better ways to explain this then please leave a comment!

How do FII Investments affect stock market?

The common wisdom is that the stock market goes up when FIIs pump money and it goes down when they take their money out.

While this is true, looking at the FII investment data for the last decade shows that it is not a simple, straight relationship.

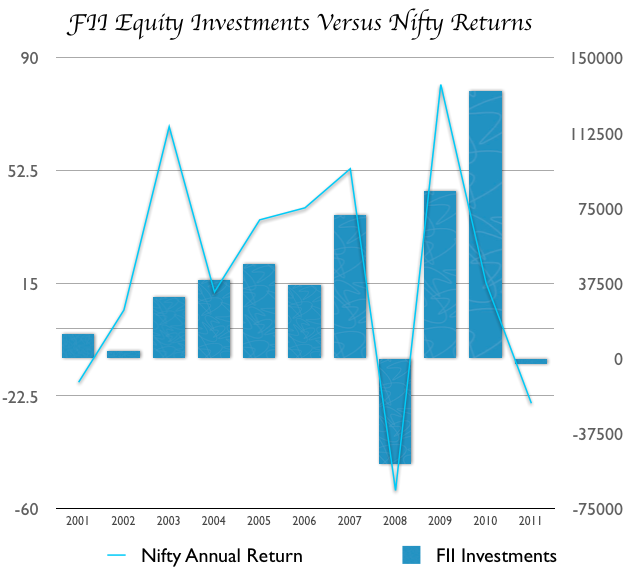
Here is a chart that shows how much money FIIs pumped into equities in each of the last 10 calendar years, and how much Nifty moved in that year. The FII investments are in Rupees Crores, and the Nifty movement is percentage change.

FiI Investments and Effect on Stock Market Returns

To me, this chart shows the following things about the effects of FII investments on the stock market:

FIIs pulling money from the market has resulted in a fall

There were only two instances in the last decade where FIIs pulled out money from the stock market and at both these times the stock market went down. The pullout was fairly severe in 2008, and the market fall was very bad as well. You may argue that just two years aren’t enough to form a conclusion but I’d say that it is fairly safe to say that if FIIs were to pull out money then the stock market will go down.

Net positive investments by FIIs don’t guarantee an upmarket

The market fell in 2001 and FIIs were actually net buyers in that year so that also shows that the market can fall even if FIIs pump in money, so just positive net investments from FIIs don’t guarantee an up market.

Biggest up moves don’t coincide with biggest FII inflows

One thing that struck me about this chart is that the biggest bars don’t coincide with sharp up-movements in the line. The biggest percentage gains in the Nifty weren’t always in the same year when FII investments were at a peak.

If you look at 2003 – the market went up quite a bit, and there were healthy inflows as well, but if you look at 2004, there were bigger inflows but the market didn’t rise up as much that year.

Similarly, 2009 and 2010 follow the same pattern. I think this can be explained with the high base effect since the market rose so much in 2003 and 2009 that there wasn’t as much room to grow in 2004 and 2010, but all the same this wasn’t something that I understood intuitively before making this chart.

You hear and read a lot about FIIs dominating the stock market movements, and that led me to believe that each big bar will coincide with a sharp rise in the line as well, which is not the case.

Some thoughts on FII Investments

Normally you hear a lot about FII investments when markets fall and people cry hoarse about Indian markets being slaves to FIIs but when the market is going up, no one complains about FIIs pumping money!

I feel that you need to look beyond these moves and think about FII and FDI investments much more holistically.

FII money is to some extent hot money especially when invested in equities and by the very nature of that investment it will be volatile. Unfortunately, India’s current account deficit has been financed by FII and FDI inflows and given the government’s serious inability to pass any policy reforms that boost FDI – FII flows become even more important. It is delusional to think they’re not important, and that India doesn’t need them.

But the other side of the coin is that the west will see slower growth rates than emerging countries like Brazil, Mexico, India or even Mongolia and therefore western pension funds and hedge funds need access to markets like India where the rate of growth is likely to be higher than their home countries.

Both sides need each other, and if policies are executed properly – this will be a win – win situation for everyone involved.

Finally, here is the raw data for the chart above.

Year Annual Return FII Investment in Equities
2001 -18 11970
2002 6 3629
2003 67 30459
2004 12 38965
2005 36 47181
2006 40 36540
2007 53 71486
2008 -54 -52987
2009 81 83424
2010 15.5 133526
2011 -25 -2812

This post was from the Suggest a Topic page.