GS Nifty Junior BeES Review
The Goldman Sachs Nifty Junior BeES is an index ETF that aims to track the CNX Nifty Junior Index.
The CNX Nifty Junior Index is an index that comprises of the 50 most liquid stocks after the Nifty, and as a result is a mid cap index.
The GS Nifty Junior BeES is an index ETF and you normally associate low costs with index ETFs because there is no active management involved, however at a 1% annualized expense ratio – this ETF is not low cost and I’m not sure why they charge 1% because they charge just half of that for their Nifty ETF and this product is no different from that.
With just over Rs. 85 crores in assets, this fund is not very big either and given that it’s been around since 2003, it shows that it hasn’t been able to attract the attention of investors quite like the other funds.
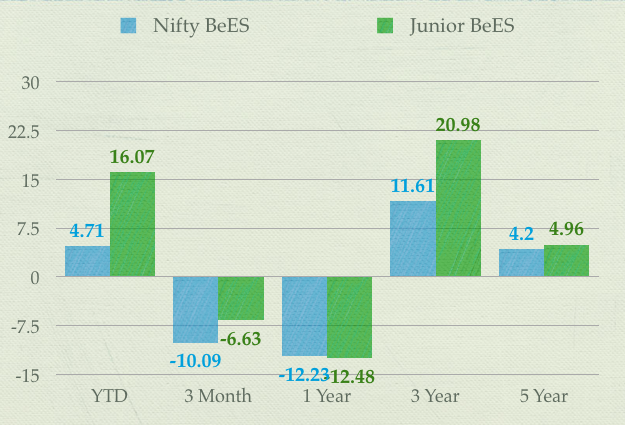
Deepika, who originally commented about this ETF wrote that this gives a feeler of safe and attractive returns, and if you look at the chart below which shows the returns of the Nifty BeES along with Junior BeES you will see why she says that.

The Junior index has run up quite a bit this year and that’s probably the reason behind the interest in the index. A few months ago I did a post on the leading Indian indices and their performance details, and that post has 10 year returns data as well which shows that the Junior index did better than the Nifty in the 10 year period but the Sensex did better than both in the 10 year period so you can’t really conclusively say that the mid caps are better than large caps.
As far as returns are concerned you see that the Nifty and Nifty Junior are quite close and it’s impossible to say which will do better in the next 5 or 10 year period.
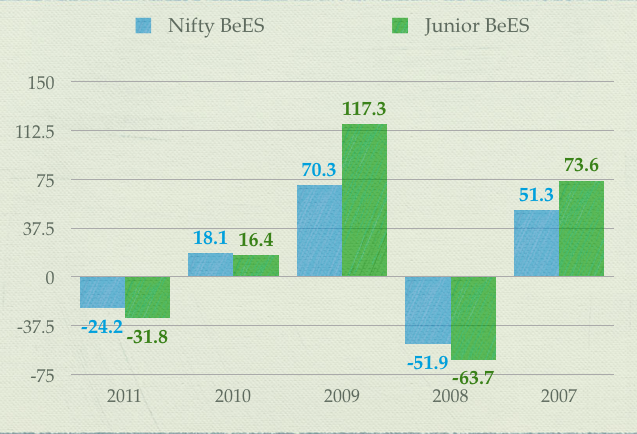
As far as safety is concerned, I think the calendar year returns chart for both the funds tells a great story. Here is the chart with data from Moneycontrol.

As you can see, Junior BeES fell a lot more than Nifty BeES during bad years, and rose a lot more than it during the good years.
This is what you’d expect of an ETF comprised of relatively smaller cap stocks and it paints an instructive picture.
While the returns in the past may be similar or even better, they came with a higher volatility and you must have been willing and able to stomach that.
Personally, I’d favor the Nifty ETF instead of the Nifty Junior ETF because of the lower cost, lower volatility and higher assets under management.
This post is from the Suggest a Topic page.

Manshu – A couple of additions to your post:
1. Yes 1% Expense Ratio is very high for an ETF, but also consider that:
a. There are no comparable mutual funds covering this space of the market (the nifty junior index) that will offer you anything for less than 1.75% or 2%. Yes we need to add brokerage costs as well for transacting in this so the 1% may in effect become 1.25% due to trading costs etc.
b. These guys give periodic dividends – so you are in effect getting “total returns” not just index returns.
2. Mid Caps are inherently riskier than large caps, so you get better returns when there is upside, at the same time you also face higher losses when the markets tank.
Just to your point of total returns, and this is something we spoke about last time as well on the index funds performance I haven’t taken index numbers to show performance data, I have taken performance data from MC and Value Research to show performance and that includes dividend effects as well.
Thanks for the other points, I think the reason why these guys are charging 1% is because the others are charging higher as you say and now it’s up to some other fund company to come up with a lower fee.
On the total returns thing, you can check http://www.benchmarkfunds.com/Documents/Factsheet.pdf
As of 30-March-2012, AUM is 86 Crores and the performance since the inception of the fund in 21-Feb-2003 is:
Item – CAGR Returns (include effect of dividends)
GS Junior BeES – 24.82%
CNX Nifty Junior Index – 24.69%
CNX Nifty Junior Index (Total Returns) – 26.47%
The thing is that if we invest in a normal index fund, since they simply eat up the dividend, we would have got something like 23.19% (this is 24.69 – 1.5%).
No fund is allowed to keep the dividend for itself and pay that to their sponsors. The dividends are part of the asset under management and every fund treats them the same way. I’m not sure if you’re saying this or if you mean something else when you say that they simply eat up the dividend.
yes the dividends are a part of AUM – agree. However the other funds are benchmarked to index, and not total returns. So whatever dividends are declared by the underlying shares, they become a part of AUM. In theory the dividends should pile up and we investors should be getting them, however this does not seem to happen for any of the index mutual funds. You can actually look at an Index Fund like Franklin Templeton Nifty Index fund and see its performance. It has roughly delivered the underlying nifty returns less 1% (which is the expense ratio). Where the dividends have gone is any body’s guess.
Here is the MC link that shows the return for these two funds and if you see it every year there is hardly any difference
http://www.moneycontrol.com/mutual-funds/nav/franklin-india-index-fund-nse-nifty-plan/MTE035
http://www.moneycontrol.com/mutual-funds/nav/goldman-sachs-nifty-exchange-traded-scheme/MBM001
I don’t think all index funds other than the GS ones are perpetrating any fraud as you suggest.
Manshu – I did not mean to say fraud. I just said that the dividends are not available in the hands of the investor. Here is the underlying data as per mutualfundsindia.com (returns in CAGR):
5 Year returns – NiftyBees 4.6%, Franklin India Index Fund – NSE Nifty Plan – Growth 3.5%
3 Year returns – NiftyBees 12.3%, Franklin India Index Fund – NSE Nifty Plan – Growth 11.4%
1 Year returns – NiftyBees -10.6%, Franklin India Index Fund – NSE Nifty Plan – Growth -11.5%
The expense ratios of these funds are 0.5% and 1% respectively. Over longer periods, the variance in performance is due to dividends, not expense ratios. In fact of you look at the analysis I did earlier on http://nitnblogs.blogspot.in/2012/03/why-costs-and-tracking-error-are-not.html all the index funds other than NIFTYBEES are delivering only index returns and *not* “total returns”.
The 7 year returns for NiftyBees vs. Franklin were 14.46% versus 13.54% on the day of the analysis of my blog post.
I am not a nig fan of NiftyBees, but this is the only fund in the market which religiously has delivered returns close to “total returns” which accounts for dividends. Whether this will continue is not known, and also whether others will come in with similar products remains to be seen.
I get all that but if you’re saying the tracking error is because they eat the dividend and not because of expenses or lower yielding liquid assets or just because of the way these assets were acquired then that’s fraud.
Good piece of valuable information
Came across this ~5 year old post when researching the nifty jr bees ETF – now owned by Reliance. Like most Onemint blogs, this was v. useful despite its age. The expense ratio is now 0.4% as per value research, so thats an improvement and the AUM is higher too.
Re. volatiltiy of Nifty Jr vs Nifty-50, this is something I felt was in favour of the Jr index. I will be investing in SIP form (weekly SIP), and for a 10 year+ horizon. Reasonably sure of +ve returns over 10 year period. And there, esp in SIP form, the higher beta should work in favour of Nifty Junior (now renamed as “Nifty Next-50”).