Earlier in the week I looked at how the government raises money, and in this post I’m going to look at a few charts on how the government spends its money.
There are two heads of government spending – Non Plan Expenditure and Plan Expenditure. Non Plan Expenditure is money that’s spent on sustaining the country like defense, postal deficit, subsidies etc. and Plan Expenditure is the money that is spent on improving the country like the money spent on dams, roads etc.
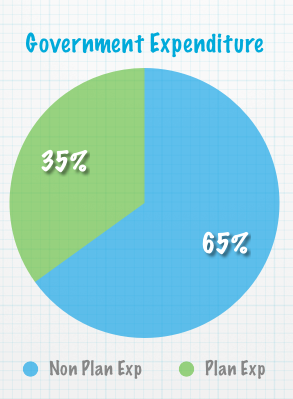
It won’t surprise you to learn that a lot more is spent on sustaining ourselves than is spent on improving the infrastructure etc. and here is a pie chart that shows how this ratio is expected to look like in 2012.

The absolute numbers for this is Rs. 9,69,920.90 crores of Non Plan Expenditure and 5,21,025.00 crores of plan expenditure.
But if the government spends so much on sustaining us – where does that money go?
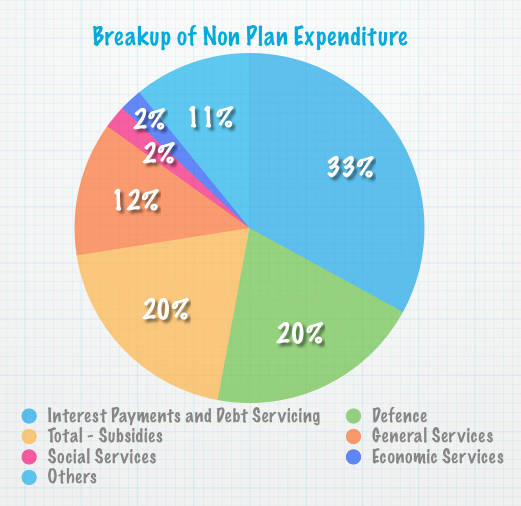
Here is a pie chart that shows the spending on the major non plan expenditure heads.

This chart would probably surprise people who see this break up for the first time, but others would know that a large part of the spending goes in making interest payments of the debt that we’ve accumulated over the years, and the next biggest head is Defense of course.
Here are the absolute numbers.
| Heads | Rs. In Crores |
| Interest Payments and Debt Servicing | Â 319,759.43 |
| Defence | Â 193,407.29 |
| Total – Subsidies | Â 190,015.13 |
| General Services | Â 120,086.08 |
| Social Services | Â 20,784.13 |
| Economic Services | Â 20,479.24 |
| Others | Â 105,368.99 |
| Grand Total | Â 969,900.29 |
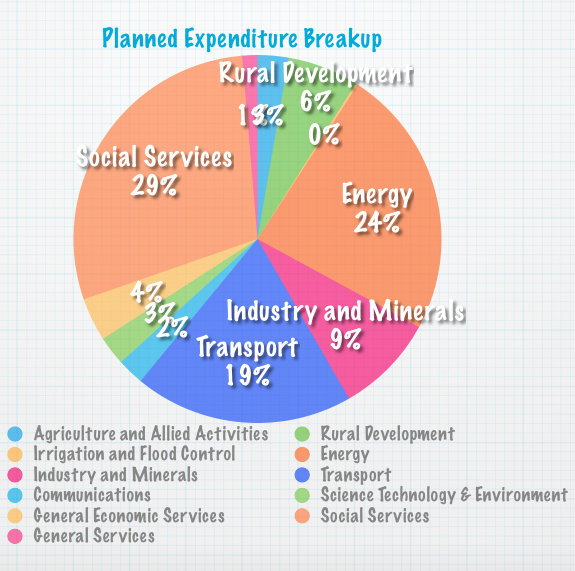
Now, let’s move on to plan spending. Here is a pie chart with the break up on the plan spending.

The big spend here is Social Services and that comprises of a lot of items under broad heads like Education, Health, Housing, Art and Culture, Water Supply etc.
Here are the absolute numbers.
| Agriculture and Allied Activities | 17692.37 |
| Rural Development | 40763.45 |
| Irrigation and Flood Control | 1275.00 |
| Energy | 154841.94 |
| Industry and Minerals | 57226.76 |
| Transport | 125357.06 |
| Communications | 15411.38 |
| Science Technology & Environment | 16591.65 |
| General Economic Services | 24777.28 |
| Social Services | 188871.69 |
| General Services | 8700.67 |
| Grand Ttotal | 651509.25 |
I think perhaps the biggest thing to take away from this post is how nothing is free and how money that’s used to subsidize oil has to be later borrowed which then accrues interest on it and then paying that interest eats up into money that you could use to finance growth.

thanks for sharing the useful knowledge.
thanks for letting me know the information of the budgetary resources of india
Dear Manshu
In above part of post you have written that plan expenditure is 5,21,025.00 and in below pie chart it is 651509.25. Can you explain that ?
Dear Sahil – the plan expenditure 5,21,025.00 is the central plan outlay and the the 651,509 is broken out according to sectors. You can see these numbers here in the files at this page:
http://indiabudget.nic.in/glance.asp
Central Plan Outlay
Central Plan Outlay by Sectors.
Dear Manshu
Thanks for the reply. But my question was plan expenditure and broken according to sector should be same ? because plan expenditure is same what government will spend on different sector like agri, rural etc or . So can you please clarify on it ?
Because it includes a component called Internal and External Budgetary Resources that has money that is raised by PSUs and spent on these sectors. That’s how it appears to be higher. I sent you an email response as well but the email bounced back.
hey Shirish,
can u help me understand what is real GDP and Nominal GDP.. difference btwn the both..pls..
thank you..
Nominal growth is the absolute number, and real is adjusted for inflation.
Thanks for responding to my request about infographics on how govt spends money. It may be worthwhile to mention that GDP estimate for FY11-12 is 8912179 crores (about 1.739 trillion US$ @ 51.25 Rs/$) and GDP estimate for FY 12-13 is 10159884 crore (about 1.98 trillion US$ @ 51.25 Rs/$). This represents 14% growth in GDP. Now this may sound very high, but this includes real GDP growth (7.6%) and inflation (6.4%)!
Regards,
Awesome comment – thanks for that info – didn’t realize India expects to be a 2 trillion economy next year.
@Manshu,
Excellent analysis, appreciate your work.
Thanks for taking the time out to leave a comment!
Major chunk goes to the Swiss accounts of politicians and under the bed/sofa of bureaucrats. May even reach people involved in anti-social activities. If left, then spent on above mentioned Social Services.
I like how you wrote “bed / sofa” 🙂
Insightful post and good graphics -Picture is worth 1000 words!.
As you rightly pointed out Indian Govt is in catch 22 situation and how money that’s used to subsidize oil has to be later borrowed which then accrues interest on it and then paying that interest eats up into money that you could use to finance growth.
What they need and perhaps the whole country does is to move away from a jugaad mentality and try to come up with real solutions that will solve the problem long term even if they are difficult to implement right away.