What are the twin deficits?

With the budget looming close, the reference to India’s twin deficits have increased even more than usual, and I thought I’d do a quick post on them.

When someone refers to India’s twin deficits, they are referring to the following two things:

  • Current Account Deficit
  • Fiscal Deficit

Current Account Deficit: I have done a fairly detailed post on current account deficit (Read: What is BoP and Current Account Deficit?) so I will keep this definition brief. Current account deficit is the difference between a country’s exports and imports, and when imports exceed exports, a country is said to be running a deficit on its current account.

Oil and gold are India’s two big imports, and the last budget saw the duty on gold being raised from 2% to 4% in order to slow down gold imports and ease the current account deficit. This hardly helped, and India will have a current account deficit again. Any measures in the budget to slow down imports or boost exports will help the current account deficit.

Fiscal Deficit: Fiscal deficit is the difference between the revenues and expenses of the government that they have to cover by engaging in borrowing from the market.

This covers everything and is not restricted to imports or exports. Any measures to reduce spending, or generate additional tax revenues or other revenues like disinvestment are aimed to bring the fiscal deficit under control. (Read: What is fiscal deficit?)

Why are these two a problem?

Why do we hear so much about these two deficits, and why are they a problem?

A lot of countries run these deficits and having these deficits is not a problem on its own. It is the magnitude that’s the problem. In the last budget, the government borrowing constituted about 35% of their total revenues. This means that the government had to raise money even to pay for their recurring expenses, and that’s never a good thing.

Imports exceeding exports perennially can become a problem because the country has to part with foreign exchange with which it pays for these exports and in India’s case, the forex hasn’t been a problem in recent years because of capital inflows like FII money, but you can’t rely on them all the time.

Together they weaken the country’s financial position, and let’s hope to see some good measures on easing the burden on them in this budget.

IPO Safety Net

The idea of an IPO Safety Net is being discussed since the past couple of months or so and there were some news articles that said SEBI might even make it mandatory, but even before that Sai Silks came out with an IPO last week, and included the safety net scheme in that.

Under this scheme, if the share price fell below the IPO price at any time within 6 months from the issue of shares, the promoters will buy back shares from retail investors at the IPO price. Sai Silks put a limit of 1,000 shares per investor under this scheme. This of course only applies to the original allottee and if you bought the share from the stock market after it listed then you won’t be covered under this safety net.

This is not the first time a company has done this, and about 7 years ago – Usher Agro had also come out with a safety net.

I don’t see the point of this scheme and feel that if made mandatory it will be counter productive to its good intentions which is to protect the small investors against IPOs that fall very badly after listing.

Most small investors who invest in the IPO market have no intention of holding the stock for more than a few days and sell it if they can make a small gain. You can’t and you shouldn’t protect against this type of mentality. People should understand that equity is risky, and people should only speculate if they can stomach losing money.

If the idea is to kick start the IPO market again, then this will not solve it because the IPO market has slowed down due to the fact that there are hardly any good companies that have listed with a reasonable price. Till such time that good companies list in the market at a reasonable price, the IPO market won’t get started again, and this step, if made mandatory, creates a disincentive for good companies to list.

The promoters part with their stake in the company, and if the share falls due to a broader fall in the market, they have to now make good losses of the retail investors as well. So, first they part with their stake, and then they part with their money?

I think this creates an disincentive for good companies to list, or list their stocks at a considerable discount to what they feel is the intrinsic value which will in turn give rise to an IPO pop at the day of listing, and people will be busy selling within a few hours. This will also mean that a lot more people apply for shares and get only a handful shares at subscription. There is no benefit of being in this situation either.

I feel this is a bad idea and if a company wants to create such a safety net then they are free to do so but forcing it on all companies creates perverse incentives in the market, and won’t contribue to an environment where a healthy capital market can flourish.

This post was from the Suggest a Topic page.

PFC India Tax Free Bonds – 2013

PFC is the latest company to announce tax free bonds, and their issue will start on Monday February 18th 2013, and close on March 15 2013.

Interest rates have been gradually coming down on these tax free bonds since last year and I believe the current issue from PFC has the lowest interest rate of any tax free bond issued since last year.

Option Tranche- II Series 1 Tranche- II Series 2
Tenor 10 years 15 years
Coupon Rate for Retail Investors 7.38% 7.54%
For Others 6.88% 7.04%
Interest Payment Annual Annual

To be fair, this is not all that lower than the 7.69% being offerred by IIFCL for the same duration, but the trend is clearly downwards, last year all the tax free bonds had a 8 handle for retail investors in the 10 year range.

The bond is rated ‘[ICRA] AAA’ by ICRA,   ‘CRISIL AAA /Stable’ by CRISIL  and ‘CARE AAA’ by CARE, and will be listed on BSE.

Who is a retail investor?

Like other bonds, the definition of retail investor is the same in this issue as well, and an individual or HUF who invests less than Rs. 10 lakhs falls under this category.

The retail investor will get a 0.50% higher interest rate than other investors, but that is only available to people who directly subscribe to the issue and once you buy the bond from the secondary market you no longer get the 0.50% extra interest rate.

Conclusion and Interest Rate Direction

For a retail investor in the 30% tax bracket, these are still good debt options because the bonds listed on the market are trading at higher than face value, and you can use these bonds to form a part of the debt portion of your portfolio. The interest rates have been going lower in the past couple of years, and it is likely that it continues to go down in the near future as well, so it makes sense to lock these rates for the long term while you still can.

Click here to download the application form

Enhanced by Zemanta

Valentine’s day weekend links

Let’s start this week with Jason Zweig’s A ‘Bucket List’ for Better Diversification which is an article on diversification from an American perspective and while the zero percent interest rate scenario doesn’t prevail in India, after inflation the returns on fixed income is pretty much negative and the stock market hasn’t done too well in the last five years or so either so I think Indian investors will find this article useful as well.

I have no words to describe how amazed how I was to read that George Soros is said to have made a billion dollars since September of last year betting against the Yen.

A very very good article from Zen Habits on four habits that help form habits.

Today, an asteroid which is about 45 meters in diameter will swish past within 27,000 kms of Earth which is the closest any asteroid has come in recorded history.

Bill Gates does a great Reddit AMA, which is an interview where anyone with an internet connection can ask questions of Bill Gates. It was great.
Finally, the animal kingdom routinely surprises me with weird behaviors but I don’t think I’ve read anything weirder than this: Sea Slug Discards Its Penis After Sex and Grows Another
Enjoy your weekend!

List of Best Balanced Mutual Funds – Updated

Balanced funds are hybrid mutual funds that invest in equity and debt instruments, and usually balanced equity funds invest no more than 35% of their money in debt instruments.

I created a list of the best balanced funds in India in March 2011, and I thought of updating that list as it is close to 2 years since it was created last.

I’m not a big fan of these type of lists because no matter how much you say that past performance is not an indicator of future performance, at the end of the day, if you’re making these type of lists then that shows that you do give a lot of weight to how the fund has behaved in a certain manner.

But I do feel that among all the factors I have seen to evaluate mutual funds, past performance is something that everyone relies and does help you to a certain extent.

For example, in my last list almost 2 years ago there were 10 funds, and based on the best 5 year performance, 8 of those funds feature in the list today as well.

Was there any way to know which 2 would drop out? No, absolutely not. So there is some utility but only so much.

With that said, here is the list of the best balanced funds ordered according to their five year performance.

Fund 1 Year Return 3 Year Return 5 Year Return
HDFC Children Gift Investment 12.07% 15.34% 11.87%
Reliance Regular Savings Balanced 17.46% 9.75% 10.88%
HDFC Balanced 9.76% 11.72% 10.85%
HDFC Prudence 10.21% 10.99% 10.64%
Canara Robeco Balance 14.11% 10.31% 8.83%
Birla Sun Life 95 12.88% 9.91% 8.44%
ICICI Prudential Equity Volatility Advantage 20.67% 12.91% 8.22%
Tata Balanced 16.14% 10.30% 7.96%
UTI CCP Advantage 9.56% 6.25% 7.85%
DSPBR Balanced 8.20% 7.30% 7.18%

The two funds that were present in the earlier list but have dropped down now:

FT India Balanced 12.41% 8.67% 5.90%
Principal Conservative Growth 17.74% 5.73% 3.99%


Budget 80C and DTC

With the budget only a few days away, the media is buzzing with articles about what is expected out of the budget, and how things might shape up.

One of the recurring topics I see is raising the 80C investment limit from Rs. 1 lakh to Rs. 2 lakhs. Obviously a lot of people are hoping that this change comes to be, and the cap is raised to Rs. 2 lakhs or even higher.

This is a far cry from a few years ago when Direct Tax Code was supposed to be implemented and all of 80C exemptions were going to be eliminated.

Quite a few people used to write in comments at the time wondering about the fate of ELSS funds, and whether they should invest in them given that very soon they will not even be in existence any more. These were obviously valid concerns and if someone didn’t invest in ELSS funds because of this and next year they double the limit – that person has got to feel duped.

Then there is the whole question of the rationale of the DTC and how it was supposed to simplify tax structure and reduce rates. Instead all we have seen are things like RGESS which does a lot more to complicate the already hard to understand tax structure, and now if they raise the 80C limit, I’m sure there will be some tinkering with elements within that as well and that will add to the complicated structure as well.

If this continues to happen, then I think they can just stop pretending that DTC will eventually be implemented because the uncertainty does no good, and the introduction of RGESS shows that we aren’t going to move to a simple tax structure any time soon.

It is probably too late to do anything about it now, but I would much rather have a simple tax structure with lower tax rates instead of all these exemptions with their sub-limits and complexities.

Enhanced by Zemanta

An update on Franklin Templeton Dynamic PE ratio Fund of Funds

I wrote about Franklin Templeton Dynamic PE Ratio Fund a little under two years ago, and I thought of looking at its recent performance when Business Line put in a buy recommendation for the fund in a recent article. 

Essentially what this fund of funds does is allocate money in a debt or equity fund based on what the current P/E ratio of the market. This way it can allocate more money to equities when the market is down, and allocate more money to debt when the market is high and risks going down. Currently it has 60% in equity and 40% in debt.

The two fund it invests its money are Franklin India Bluechip Fund and Templeton India Income Fund.

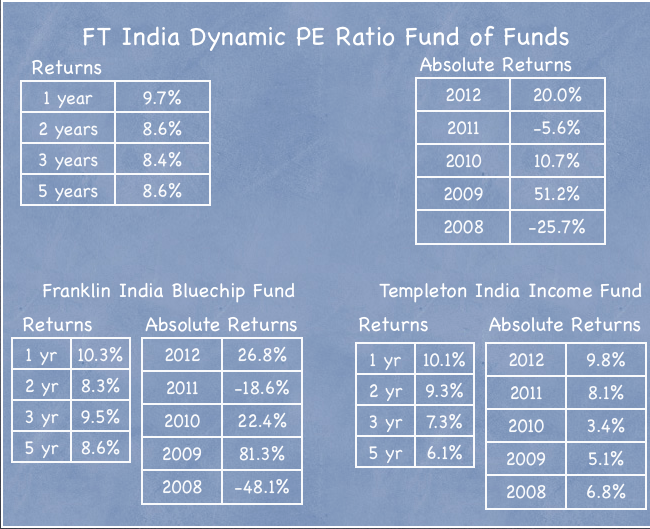
Now let’s take a look at how these three funds have performed in the past few years.

FT India Dynamic PE Ratio Fund of Funds

I think the chart above is a very useful way of looking at these three funds and see what’s going on in their performance.

Franklin Templeton Dynamic PE Fund returns similar to the returns of Franklin India Bluechip Fund

What strikes me most about this is that FT India Dynamic PE Fund has returns that matched the Franklin India Bluechip Fund in the longer run, and wasn’t able to out do it even when the equity markets haven’t been good for the past few years.

Protection against volatility

The second thing that strikes me about this is that if you wanted to invest in equities but were wary of the volatility and sudden crashes of the market then this would have proved to be a good option as it protected you from the violent downswings that the past few years have brought in the equity market.

Templeton India Income Fund dragging down returns

Moneycontrol ranks this income fund as one of the lower returning ones based on past returns and that has been consistent over the past few years, so you can see that this fund has been dragging down the returns of the Dynamic PE Fund as well.

Returns comparable to balanced funds

When I wrote about this fund almost two years ago I made the following observation about it with respect to balanced funds:

The fund still beat its benchmark but if you look at my best balanced funds post you will notice that there are quite a few funds that have bettered this performance over the 3 year and 5 year range.

So, when thinking about investing in a PE fund – whether this or another – just take a look at how other balanced funds are performing as well because they are similar in structure.

A good balanced fund like HDFC Prudence has returned 11.2% annualized in the past 5 years which is higher than this and while it is not fair to pick just one good balanced fund and compare its return with this fund the point I’m trying to make is that balanced funds that don’t rely on P/E strategies but invest about 35% or so in debt regardless of P/E levels have been doing at least as well as this fund.

P/E Strategy No Magic Bullet 

Theoretically, the P/E strategy sounds good – you invest more when the market is down and more when the market is up, but in practice it’s no magic bullet. The fund has done well, and there is no harm in investing in such a fund, but where you would go wrong is to expect some kind of sensational returns. In the past it has performed like a balanced fund, and these are decent returns when thinking about how the equity market has done in the same time frame, but that’s about it – it hasn’t given you an edge over them, and won’t do so in the future either.

Source of returns:

Enhanced by Zemanta

Mutual Funds that have performed well over the last 10 years

FundsIndia has come up with an interesting research report titled: The FundsIndia 5 Best Schemes in the History of Indian Mutual Funds.

In this report they have listed down 5 equity funds that have done well over very long periods of time, and have given a little history about them, how they made their money, and fund managing style.

The first question I had upon reading this title was how do you select the paramaters for such a report? Do you stop at returns or do you go deeper and look at other things as well?

Here are the five things that they chose to see:

1. Longevity: Funds that are at least 10 years old
2. Performance: Ability to deliver higher than benchmark returns consistently
3. Resilience: Ability to withstand market downturns better than its benchmarks
4. Stability: Consistency of fund management principles and personnel
5. Investment-worthy: Their recent performances have not caused any concern keeping them investment worthy even today.

I think these are all good parameters but in my opinion if you are evaluating hundreds of mutual funds you should describe these mathematically and then evaluate funds on them. For example, stability can be shown by the number of fund managers that a particular fund had since its inception. I don’t think they went to that level of detail although they have used numbers to evaluate the funds.

The next question I had was if you select 10 years as the cut off point – how many funds do you really have left, and in then within that how many would have a performance worthy of  a second look?

To answer this I went to the following categories on Value Research and arranged the funds in descending order of their 10 year returns.

There were two things that struck me from looking at these funds in this manner:

Sheer number and range: I was amazed to see the sheer number  and range of equity funds that have done quite well over a 10 year period. The five funds that FundsIndia selected belong to 4 different categories according to Value Research and they are usually not the highest performing funds in that category for the 10 year period.

Difference between the 5 year and 10 year return number: The large number of funds that have returned over 20% returns for 10 years is simply mind boggling, but the same funds have pitiful returns over the last 5 years. This reinforces what most readers already know – the last five years have been bad for equity investors and no matter how good your mutual fund is – if the market doesn’t do well, how can the fund do well?

Given this background, while I think the report is useful and everyone should invest the ten minutes it will take to read the report, look at the fund names, and their story – I’m not convinced that you can call these five funds the best without a shadow of doubt, and indeed can you ever select five funds that you could call that?

Read the report here: The FundsIndia 5 Best Schemes in the History of Indian Mutual Funds.

Disclaimer: FundsIndia is an advertiser on OneMint.

Share Analysis: Buybacks and Free Cash Flows

I wrote about 5 ways to generate share investing ideas a few weeks ago, and once you have the initial idea – the next thing is to evaluate how good or bad the company is with respect to its price.

There are several parameters for this, and in this post I’d like to talk about two that I was reminded recently when AOL (American Online) declared its quarterly results.

I’m interested in both Indian and American markets, and AOL is a stock that’s listed on NYSE. The company has two main business segments – it provides dial up internet service and runs popular websites such as TechCrunch and Huffington Post.

This company used to be a lot more relevant a few years ago, and somewhere about a year and a half ago I got the idea to see if this company will be a suitable short candidate (like thousands of other people I’m sure).

Here are my notes from that time (absolutely unedited):

S.No. Question Comment
1 What is the product and is this a good product? AOL has two products – it has content websites like aol.com huffington post and TechCrunch and it is a dialup internet service provider
2 What is the size relative to its peers? It has a market cap of 1.4 billion so not very big
3 Category Short candidate due to declining revenues
4 Conclusion Should DEFINITELY NOT short it yet, but it will become a short candidate in the future. Why you shouldn’t short it now:1. The company has a share buyback program2. It generates free cash flow.Free cash flow has declined from 389.5 mm in the 9 months 2010 to 92.1 mm this year. Keep observing if the free cash flow continues to decline and keep it in the short list.The company has authorized 250 mm buyback program and the market cap is 1.4 bn so they are going to buy back about 20% of their own stock, and then with the free cash flow they can authorize more buybacks as well.
5 List the products & their contribution to bottomline Advertising – which is ads on its websites, and subscription viz. monthly charges for its internet service.

Since the time I wrote down these things, the stock has almost doubled so I feel rather stupid when I read this today. Not only was this not a short candidate, but instead it was a great long candidate!

However, for the purpose this post, I’d like to highlight the two things that I paid attention to at the time, and are worth your time too if you are looking at analyzing stocks.

Free Cash Flow: Free cash flow (FCF) is perhaps one of the most important things to look for in a business. Simply put, it’s the surplus cash with the business. Every business that generates cash needs to put some of it back in its operations to sustain the business. FCF is the cash that’s left after that.

Investopedia has a good definition:

A measure of financial performance calculated as operating cash flow minus capital expenditures. Free cash flow (FCF) represents the cash that a company is able to generate after laying out the money required to maintain or expand its asset base. Free cash flow is important because it allows a company to pursue opportunities that enhance shareholder value. Without cash, it’s tough to develop new products, make acquisitions, pay dividends and reduce debt. FCF is calculated as:

EBIT(1-Tax Rate) + Depreciation & Amortization – Change in Net Working Capital – Capital Expenditure

It can also be calculated by taking operating cash flow and subtracting capital expenditures.

Read more:

http://www.investopedia.com/terms/f/freecashflow.asp#ixzz2KSeVPpbl


Share Buybacks: Share buybacks are another interesting thing to look out for because a company that’s buying back its shares has a smaller capital base and thus the profits available to each shareholder increase over time if the company makes money at the same rate. It also implies that the company is generating sufficient cash to pay for its operations, pay down debt, and can now reward the shareholders in this way.

These two things are good to look at, but remember that they have to be seen within the whole context of the company and its operating environment, and you can’t rely on just these two factors alone.

Enhanced by Zemanta

Leopard seal fakes enthusiasm to get a job at SEZ

Twitter was abuzz with Narendra Modi’s speech this week, and although this Business Standard article doesn’t add anything new to  what’s been written elsewhere, this is a big event keeping in mind that next year will be an election year.

Here’s something that everyone probably knows at the back of their minds but no one really talks about openly that much: Why faking enthusiasm is the latest job requirement. 

Harvard Business School’s Working Knowledge has an interesting article about being more productive. These are not productivity tips but rather look at productivity from another angle in terms of how you structure your work, manage your relationship with your boss etc.

IRDA caps insurance company’s exposure to equity at 15%. The Finance Ministry wanted this to be 30% for LIC so it is interesting that IRDA maintained a lower cap and didn’t make an exception for LIC. I think this is a great move with all the upcoming PSU IPOs, OFSs etc.

A rare positive story on India’s SEZs. I didn’t know that Foxconn was manufacturing in India, and this is a good post that boosts your confidence about the potential success of manufacturing in India.

An amazing video of one National Geographic photographer’s encounter with a leopard seal.

Finally, if all your friends decide to jump off a bridge, you should too.

Enjoy your weekend!


Enhanced by Zemanta