


Every time gold corrects sharply, the same reassurance circulates across Indian family WhatsApp groups and retail brokerage feeds: "Gold always comes back; just hold and everything is fine." That comfort was easy to hold in mid-November 2026 when domestic 24-karat gold hovered near ₹1,35,800–₹1,36,800 per 10 grams—roughly 26% below its late-January peak. By Friday, 20 November 2026, however, a single-session slide of ₹6,401 (-4.92%) knocked the India Bullion and Jewellers Association (IBJA) 999 national benchmark down to ₹1,23,584 per 10 grams, while retail 24K rates fell to ₹1,25,080 per 10 grams on Saturday, 21 November 2026.
For the millions of Indian households who piled into gold near the top—including the record ₹24,040 crore that flowed into domestic Gold ETFs in January 2026 alone, briefly eclipsing equity mutual fund inflows for the first time—the gap between the ticker decline and the actual hole in their wallet is wider than most assume. Once you account for non-recoverable 3% GST, coin or jewellery making charges, cash buyback haircuts, ten months of missed interest, and the unforgiving arithmetic of recovering from a 30%–40% drawdown, "just waiting it out" carries a measurable multi-year cost (all benchmark prices, tax provisions under the Income-tax Act, 2025, and calculations below are current as of 21 November 2026).
1. The Real Numbers: Why the Drawdown Depends on Which Quote You Check
Before calculating losses, it helps to separate the four different "gold prices" cited in Indian headlines, because mixing a tax-inclusive bullion peak with a pre-tax benchmark exaggerates or hides the true drop. On 29–30 January 2026, global spot gold surged past $5,500 to peak at $5,595 per troy ounce (LBMA AM fix: $5,501.70/oz) before tumbling the next day on US monetary-policy and dollar-yield shifts. By 20 November 2026, international spot gold had fallen to $3,538–$3,572 per ounce—a global dollar decline of roughly 36.2% to 36.8%.
Indian rupee prices fell slightly less than global dollar prices only because two domestic wedges cushioned the fall: the central government revised customs duties on gold from 6% to 15% effective 13 May 2026, and a weaker rupee kept landed costs higher. Even with those buffers, the peak-to-trough drop across every Indian benchmark has now crossed the 26% mid-November milestone and sits near 30%:
| Gold Price Series | January 2026 Peak (29–30 Jan) | Mid-Nov 2026 Reference (16–17 Nov) | Latest Rate (20–21 Nov 2026) | Peak-to-Latest Drop |
|---|---|---|---|---|
| Global Spot Gold (USD / oz) | $5,595.00 | approx. $3,772 (18 Nov) | $3,537.86–$3,572.00 (20 Nov) | -36.2% to -36.8% |
| IBJA 999 / 24K Benchmark (Pre-GST, per 10g) | ₹1,75,340 (29 Jan close) | ₹1,31,505 (18 Nov AM) | ₹1,23,584 (20 Nov AM) | -29.52% |
| Retail 24K National Average (Pre-GST, per 10g) | ₹1,78,850 (29 Jan) | ₹1,36,040–₹1,36,800 | ₹1,25,080 (21 Nov) | -30.06% |
| Delhi Bullion 24K (Tax-Inclusive, per 10g) | ₹1,83,000 (30 Jan) | approx. ₹1,40,120 (incl. 3% GST) | approx. ₹1,28,832 (₹1,25,080 + 3% GST) | -29.60% |
Source Discrepancy Note: Several news reports quote a 32% crash by comparing Delhi's tax-inclusive ₹1,83,000 peak directly against pre-GST spot quotes near ₹1,22,000–₹1,24,000, while mid-November drafts used ₹1,35,800 (-25.8%) before the sharp 18–20 November sell-off. To keep every apples-to-apples calculation clean, the worked math below consistently uses the IBJA 999 national benchmark (₹1,75,340 on 29 January 2026 to ₹1,23,584 on 20 November 2026, a -29.52% metal decline), with IBJA 916 (22K) moving in exact proportion from ₹1,60,611 to ₹1,13,203 per 10 grams.
2. Step-by-Step Mathematical Comparison: What Three January Buyers Actually Sit On Today
When the IBJA benchmark drops by 29.52%, almost no physical buyer is down "only 29.52%." That is because indirect taxes (3% GST on purchase), minting or craftsmanship fees, and cash liquidation spreads vanish the moment you walk out of the showroom.
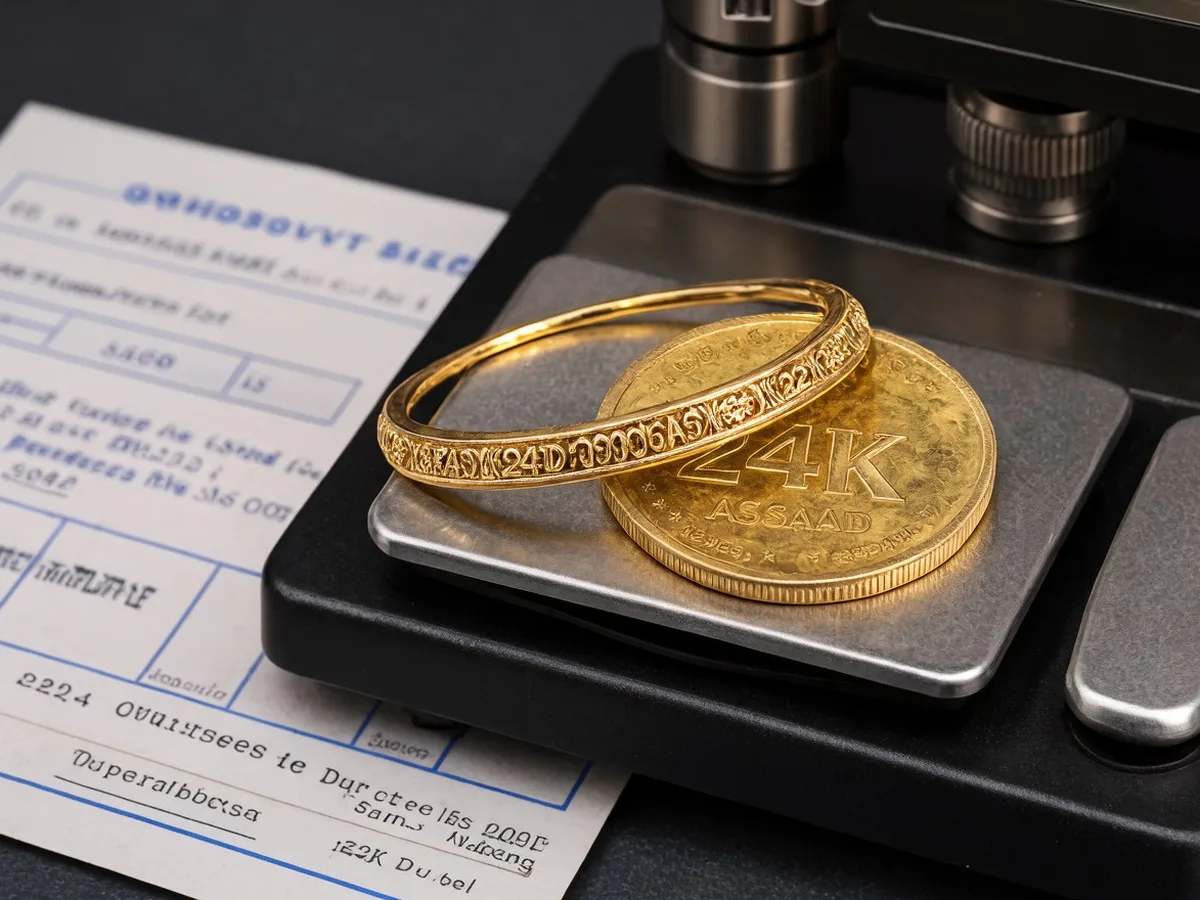
Simulation Parameters
- Purchase Date & Metal Baseline: 29 January 2026 at IBJA 999 = ₹1,75,340 / 10g (22K / 916 equivalent = ₹1,60,611 / 10g).
- Valuation Date & Metal Baseline: 20 November 2026 AM at IBJA 999 = ₹1,23,584 / 10g (22K / 916 = ₹1,13,203 / 10g).
- Quantity Purchased: Exactly 10 grams of gold equivalent across three formats.
- Format Friction Assumptions:
- Gold ETF: 0% GST; 0.10% entry and exit brokerage/impact cost; 0.60% annual expense ratio (approx. 0.50% over 10 months).
- 24K Gold Coin: 4% minting/making charge; 3% GST on total invoice; 2.5% cash buyback haircut on sale.
- 22K Gold Jewellery: 12% making charge; 3% composite GST on finished ornament invoice; 3.0% cash buyback/melting deduction on sale.
Plain-Text Formulas Used
Realised Liquidation Loss (%) = [(Net Cash Received on 20 Nov − All-In Cash Paid on 29 Jan) ÷ All-In Cash Paid on 29 Jan] × 100
Rally Required to Break Even (%) = [(All-In Cash Paid on 29 Jan ÷ Net Cash Received on 20 Nov) − 1] × 100
Arithmetic Outcomes (OneMint Calculation)
Buyer 1: The Gold ETF Investor (10g Equivalent)
- All-In Cash Paid (29 Jan): ₹1,75,340 + ₹175 (0.10% brokerage/impact) = ₹1,75,515.
- Net Cash Value (20 Nov): ₹1,23,584 minus ₹618 (10-month 0.50% TER drag) minus ₹123 (0.10% exit cost) = ₹1,22,843.
- Realised Rupee Loss: -₹52,672 (-30.01%).
- Rally Needed to Break Even: +42.88% from current levels.
Buyer 2: The 24K Gold Coin Buyer (10g, 999 Purity)
- All-In Cash Paid (29 Jan): ₹1,75,340 metal + ₹7,014 (4% minting) = ₹1,82,354 + ₹5,471 (3% GST) = ₹1,87,825.
- Net Cash Value (20 Nov): ₹1,23,584 minus ₹3,090 (2.5% cash buyback spread) = ₹1,20,494.
- Realised Rupee Loss: -₹67,331 (-35.85%).
- Rally Needed to Break Even: Spot gold must climb to ₹1,92,641 / 10g—a +55.88% rally from ₹1,23,584.
Buyer 3: The 22K Retail Jewellery Buyer (10g, 916 Purity)
- All-In Cash Paid (29 Jan): ₹1,60,611 metal + ₹19,273 (12% making) = ₹1,79,884 + ₹5,397 (3% composite GST) = ₹1,85,281.
- Net Cash Value (20 Nov): ₹1,13,203 minus ₹3,396 (3.0% cash buyback deduction) = ₹1,09,807.
- Realised Rupee Loss: -₹75,474 (-40.73%).
- Rally Needed to Break Even: 22K gold must reach ₹1,91,011 / 10g (equivalent to ₹2,08,527 / 10g in 24K)—a +68.73% rally from today's 22K rate.
| January 2026 Buyer Profile (10g Equivalent) | All-In Cash Paid (29 Jan 2026) | Net Cash Exit Value (20 Nov 2026) | Actual Rupee & % Drawdown | Spot Rally Required Just to Break Even | Years to Nominal Break-Even (at 8% / 10% CAGR) |
|---|---|---|---|---|---|
| Gold ETF Buyer | ₹1,75,515 | ₹1,22,843 | -₹52,672 (-30.01%) | +42.88% | 4.6 yrs / 3.7 yrs |
| 24K Gold Coin Buyer | ₹1,87,825 | ₹1,20,494 | -₹67,331 (-35.85%) | +55.88% | 5.8 yrs / 4.7 yrs |
| 22K Jewellery Buyer (Cash Exit) | ₹1,85,281 | ₹1,09,807 | -₹75,474 (-40.73%) | +68.73% | 6.8 yrs / 5.5 yrs |
Variance Callout: Although all three buyers experienced the exact same -29.52% drop in the underlying metal, the 22K jewellery buyer faces a ₹22,802 deeper cash loss (-40.73% vs -30.01%) and needs 25.85 percentage points more market recovery (+68.73% vs +42.88%) than the Gold ETF buyer just to recover their original principal.
Advertisement
Opportunity Cost Comparison: The table above measures nominal principal recovery only. Over the 10 months between January and November 2026, putting ₹1,75,515 into a standard 7.0% fixed deposit would have grown to roughly ₹1,85,750 pre-tax (approx. ₹1,82,550 post-tax in the 30% bracket). Against that safe-cash alternative, the January Gold ETF buyer is sitting on an opportunity-adjusted gap of roughly ₹59,700 per 10 grams.
3. The Silent Trap: Nominal Break-Even vs Real Purchasing-Power Break-Even
The biggest flaw in the "just wait five years and get your money back" mindset is that ₹1,75,515 in 2030 will not buy what ₹1,75,515 bought in January 2026.
Suppose Indian consumer inflation averages 5.5% per year (close to recent 2026 CPI trends), and gold recovers at a healthy 10.0% annual nominal return from today's base. Your real, inflation-adjusted compounding rate is only 4.27% per year:
Real Compounding Rate = (1.10 ÷ 1.055) − 1 = 4.27%
Because 10 months of 2026 inflation have already raised the purchasing-power equivalent of ₹1,75,515 to roughly ₹1,83,522, the January Gold ETF buyer's real drawdown today is -33.06%, requiring a +49.40% real gain above inflation. At 4.27% real compounding, breaking even in actual purchasing power takes 9.6 years—nearly a full decade of dead capital unless another global macro shock triggers a rapid bullion spike.
History confirms that multi-year waits are not unusual for Indian gold buyers who enter at euphoria peaks:
- Following the 7 August 2020 peak, rupee gold fell 21.6% through March 2021 and took 29 months (until January 2023) to reclaim its nominal high.
- After the 9 November 2016 high, rupee gold took 23 months to break even.
- Globally, the 2011–2015 bullion bear market took nearly nine years in dollar terms to print a new high.
Meanwhile, World Gold Council Q3 2026 figures show Indian gold volume already fell 29% year-on-year to 162.5 tonnes (with bars and coins down 40% and ETF inflows down 50% by tonnage), while IBJA reported households recycled roughly 50 tonnes of old gold in April–June 2026 alone out of fear of further declines.
4. The Tax-Loss Harvesting Window Under the Income-tax Act, 2025
One practical lever available right now to January 2026 Gold ETF investors—and easily missed if you simply ignore your demat statement—is the capital-loss set-off window under the Income-tax Act, 2025 (effective 1 April 2026 for Tax Year 2026-27).
Because listed Gold ETFs qualify as long-term capital assets only when held for more than 12 months (and physical or digital gold requires more than 24 months), any investor who bought a Gold ETF in January 2026 is still inside the Short-Term Capital Loss (STCL) window until January 2027:
- Why STCL Is More Flexible Than LTCL: Under Section 108(2)(a) of the Income-tax Act, 2025 (replacing Section 70 of the 1961 Act), a Short-Term Capital Loss can be set off against both Short-Term Capital Gains (STCG) and Long-Term Capital Gains (LTCG) from any other capital asset—including equity shares, equity mutual funds, or real estate—in Tax Year 2026-27. Once your Gold ETF crosses the 12-month mark in late January 2027, the exact same paper loss converts into a Long-Term Capital Loss (LTCL), which under Section 108(2)(b) can only be set off against LTCG, never against STCG.
- 8-Year Carry Forward Rule: Any unused capital loss can be carried forward for up to 8 Tax Years under Section 111 (old Section 74), strictly provided you file your income tax return on or before the statutory due date under Section 121 (old Section 80).
- Worked Tax Value on Profile 1's ₹52,672 Loss: If you hold realised equity STCG (taxed at 20% plus 4% cess = 20.8%) in Tax Year 2026-27, harvesting a ₹52,672 Gold ETF STCL cuts your immediate tax bill by ₹10,956. If offset against taxable equity or gold LTCG (12.5% plus 4% cess = 13.0%), it saves ₹6,847.
Important Boundary: Tax-loss harvesting makes mathematical sense primarily for liquid Gold ETFs where round-trip transaction costs are approx. 0.2%. Selling physical coins or jewellery just to book a tax loss and rebuying them triggers a fresh 3% GST and making-charge hit that wipes out the tax saving.
5. How to Audit Your Underwater Gold Position in 4 Steps
Instead of ignoring your holdings or panic-selling everything on a red screen, run a four-step portfolio audit:
- Step 1: Check Your Actual Gold Allocation Weight. Add up your Gold ETFs, Sovereign Gold Bonds (SGBs), gold mutual funds, and investment coins, and divide by your total financial portfolio. Most institutional asset-allocation frameworks treat gold as a 5% to 15% portfolio hedge, not a 40% core growth engine. If gold sits under 10% of your net worth, a 30% drawdown in gold knocks less than 3% off your total portfolio—manageable without drastic moves.
- Step 2: Separate Consumption Jewellery From Investment Bullion. Never count worn family or wedding jewellery as an investment loss on your spreadsheet. If you bought 22K jewellery to wear for the next 20 years, short-term IBJA swings are noise; if you bought 22K jewellery thinking it was an investment, recognise the 12% making charge + 3% GST as a sunk consumption cost rather than waiting for spot gold to cross ₹2.08 lakh just to "break even."
- Step 3: Check Any Gold-Loan LTV Buffer Immediately. If you pledged jewellery bought or valued near January–September 2026 highs for a gold loan, a approx. 30% drop in the IBJA reference price directly compresses your collateral value. Check your lender's Loan-to-Value (LTV) margin alert so you are not hit with a sudden top-up demand or auction notice.
- Step 4: Review Your January 2026 ETF Tax Lot Before 12 Months Expire. Pull your broker's Capital Gains / P&L statement for Tax Year 2026-27. If you have booked taxable equity STCG or LTCG this year and want to rebalance out of an oversized January 2026 Gold ETF position, compare the net tax saving under Section 108(2)(a) before the holding crosses the 12-month LTCL boundary in January 2027.
6. What This Does NOT Mean (And What We Don't Know Yet)
What This Does NOT Mean
- A 30% fall does NOT mean gold has hit a guaranteed bottom. Commodity drawdowns can overshoot fundamental cost floors when leveraged futures positions unwind or US real bond yields stay elevated.
- This does NOT mean gold is a "bad" asset class. Even after falling from ₹1,75,340 to ₹1,23,584, gold remains an effective long-term hedge against rupee depreciation and equity tail-risks when sized properly (5%–15% of assets) and bought through low-friction instruments.
- Holding physical gold does NOT trigger any tax deduction unless you actually sell it. Paper (unrealised) losses cannot be claimed on your Income Tax Return.
What We Don't Know Yet
- Whether India's 15% Gold Customs Duty Will Be Cut Back: India raised gold import duty from 6% to 15% on 13 May 2026. If the central government later trims that duty back toward 6% in Union Budget 2027-28, domestic rupee gold prices could take an immediate one-time downward adjustment of roughly 7% to 8% independent of global spot prices.
- The December 2026 Central Bank Path: Both the RBI's 2–4 December 2026 MPC decision and the US Federal Reserve's December FOMC stance will shape real yields and USD/INR heading into Q1 2027—the two biggest short-term drivers of rupee bullion pricing.
Primary Sources & References (Verified as of 21 November 2026)
- India Bullion and Jewellers Association (IBJA): Daily Benchmark Data (20–21 Nov 2026). IBJA 999 benchmark peak of ₹1,75,340/10g on 29 January 2026 vs ₹1,23,584/10g on 20 November 2026 AM (IBJA 916 at ₹1,13,203/10g).
- Retail 24K & 22K Rates: National average 24K at ₹1,25,080/10g and 22K at ₹1,14,660/10g on 21 November 2026.
- Global Spot Gold: LBMA AM fix $5,501.70/oz peak (29 Jan 2026) vs $3,537.86–$3,572/oz on 20 November 2026.
- World Gold Council & Industry Flow Data: Record ₹24,040 crore Indian Gold ETF inflows in January 2026; Q3 2026 Indian gold demand down 29% YoY to 162.5 tonnes.
- Statutory Framework: Customs duty revision effective 13 May 2026 (15%); Income-tax Act, 2025 capital loss provisions under Sections 108, 111, and 121.
Advertisement