As far as I know – India has never had a trade surplus, which means that it has never exported more than it has imported, and I got curious to see what comprises of the exports of the many East Asian countries that have consistently run trade surpluses for years.
But in order to make any comparison, you need to know what India’s exports constitute of first, and I wasn’t sure of what the numbers looked like, so I went to the RBI website to look at some data.
RBI has the latest provisional foreign trade data for the 2011 April – September six month period, which shows that India’s exports were $160 billion in that time period. It is important to note that this includes only merchandise exports, and doesn’t include Services exports which are also a big foreign exchange earner for India.
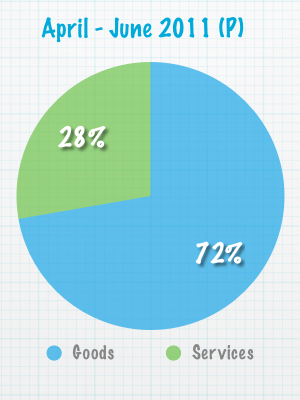
I couldn’t locate the six month number that included Services, and had to fall back upon the first quarter April – June 2011 – 12 Balance of Payment data to get the proportion between goods and services.
This data shows that the goods exported were worth $80.58 billion, and services exported were worth $30.95 billion.

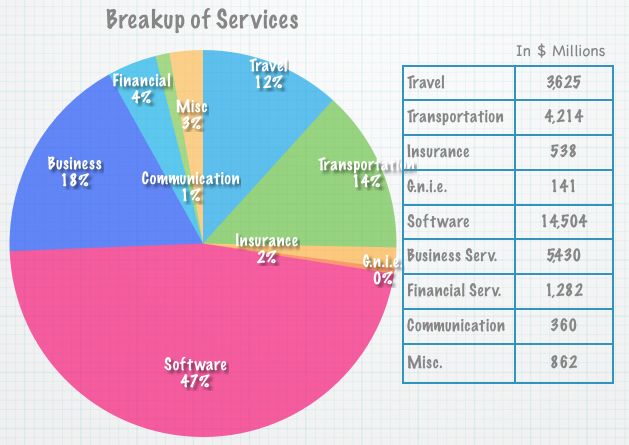
Now, that we see what the split between the goods and services look like, let’s take the smaller piece first, and see what contributes to the Services.

As expected, software exports dominate services and a large part of the services exports are what we commonly refer to as BPO and IT Enabled Services.
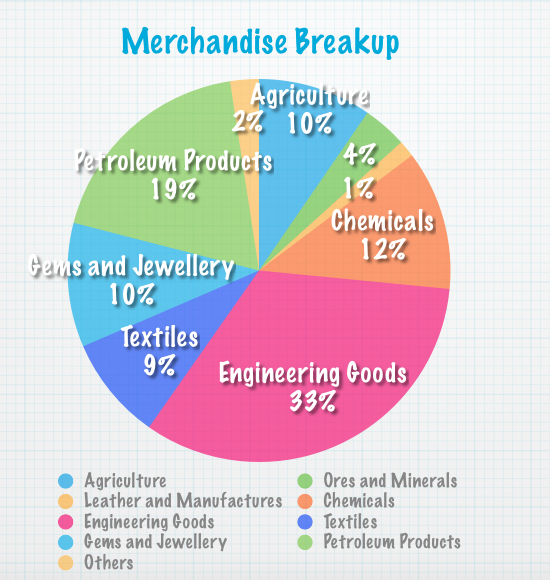
Now, let’s take a look at merchandising, which is the bigger chunk of the exports. Here is a chart that breaks out merchandise.

To make this chart easily readable – I didn’t label some smaller categories – the 4% there is Ores and Minerals, 2% is Others and 1% is Leather and Manufacturers.
The biggest category of exports is engineering exports which must be the kind of thing that a L&T, BHEL or Tata Motors exports, and petroleum products is the second largest exports which is what Reliance Industries exports which also happens to the biggest exporter out of India.
I don’t think I would have been able to guess any of these numbers correctly if I hadn’t looked at the RBI data first, and I’d like to see data for a full year to see whether this quarter represents the whole year well or if anything here is affected by seasonality of some sort.
However, by and large it looks like for all the attention that services gets – exports of engineering goods and refined petroleum products may just hold the key to run an export surplus.

Can u plz tell me how india imports as well as exports petroleum… If india has excess of petroleum than y does it import it???
information was really use full and precise…good work
Glad it came useful, thanks.
thanks a lot for making me a part of onemint,
i m really overwhelmed by this site. onemint a ready reckoner, for everything,
my hearty thanks for making me a part of onemint…
Great to hear – you’re welcome and thanks for your comment!
No one will say here curiosity kills the cat :-).
I found it very interesting..as I mentioned pushing my boundaries for I usually skip such info thinking how would reading it help. And the way you presented the information was better than RBI report.
By “rationale behind the post” I wanted to ask why have you written on this topic-usually you do such topics on some suggestion. What would a reader get on knowing about what we export?
Oh yeah, well that’s just curiosity – I read somewhere that Reliance was the biggest exporter and then I read somewhere else that US is close to becoming a net exporter of oil because they refine so much and that’s quite amazing! So, I wondered if India can ever become a net exporter of oil, but then I thought let alone net exports of oil, can India become a net exporter ever? And so on and so forth, and so many questions….
So, this is just a post for my own curiosity and I hope people find it interesting, but yeah it’s not actionable in the sense that a post about infra bonds is or interest rates is.
Manshu..everyday I learn something new from your posts..you push your readers boundaries. I usually just browse/skip such articles in newspaper. So Thanks. But wondering what was the rationale behind the informative post(more interesting than the RBI report)
Coming back to post, my two cents:
Does this data take care of the govt. goofup of overestimating exports by over $9 billion due to software upgrade and punching errors? Software glitch inflated India’s exports by $9bn, admits govt ?
From the same article According to the latest available numbers, exports rose 33% to $192.7 billion during April-November, while imports went up 30% to $309.5 billion, resulting in a trade deficit of $116.8 billion.
India imports more than the exports hence fall in rupee hurts us more..
I’m sorry I didn’t understand what you mean by “rationale behind the post”?
I never saw anything that actually said in which months or which categories the error actually existed – if it was present in an article then I missed it.
When I do another post with the data for the whole year or a longer period – we can compare the numbers to this and see if anything stands out.