Bharat 22 ETF Allotment Status & Listing

This post is written by Shiv Kukreja, who is a Certified Financial Planner and runs a financial planning firm, Ojas Capital in Delhi/NCR. He can be reached at skukreja@investitude.co.in

ICICI Prudential has initiated the allotment process of Bharat 22 ETF and I think most of the investors must have received the allotment SMS or mail from ICICI Pru or their respective brokers or DPs by now. If you have not received any such intimation mail/SMS regarding the same, then you can check your allotment status from this link available on the website of ICICI Pru AMC – Bharat 22 Allotment Status.

Bharat 22 ETF offer period started on November 15 for the non-anchor investors and closed on November 17. It received an overwhelming response from the anchor investors, Qualified Institutional Buyers (QIBs) and Non-Institutional Investors (NIIs) and got subscription worth Rs. 31,750 crore approximately. Though retail category and retirement fund categories remained undersubscribed, but given their share of reservation, it was nowhere a bad response from either of them.

Units Allotted @ Rs. 35.97 Per Unit – Retail applicants, who submitted an application of Rs. 2 lakh worth of Bharat 22 units, have been allotted 5,560 units @ Rs. 35.97 per unit, which makes it Rs. 1,99,993.20 as against Rs. 2 lakh investment. So, it is 100% allotment this time around for a government backed ETF. Investors will get the balance investment amount credited directly to their respective bank accounts.

Discount of 3% – Allotment Price of Rs. 35.97 a unit has already incorporated the discount of 3% committed by the government. It makes its market value to be Rs. 37.08 a unit. However, as compared to Friday’s closing level of 3,748.85 for the S&P BSE Bharat 22 Index, the allotment price of Rs. 35.97 translates into a notional gain of 4.22% before listing.

PAN, DP ID – Client ID Required –  You can check the allotment status of your investment in this ETF by entering your PAN number and DP ID – Client ID as you visit the allotment status link for this ETF.

Contact ICICI Pru AMC or CAMS for Allotment Issues or Queries – If you have not received any intimation, message or mail regarding its allotment and if it is not there in your demat account as well, you can either contact ICICI Prudential AMC on its toll-free no. 1800 000 6666 or 1800222 999 or its Registrar, Computer Age Management Services (CAMS) on 1800 200 2267 or 1800 419 2267.

Expected Listing on November 28 or 29 – Units of this ETF will be credited to our demat accounts on Monday and listing is expected within 2 working days post allotment.

If you have any more info about its allotment or any other query regarding Bharat 22 ETF, please share it here. I’ll try to respond to it as soon as possible.

ICICI Prudential Bharat 22 ETF NFO – November 2017 Issue

This post is written by Shiv Kukreja, who is a Certified Financial Planner and runs a financial planning firm, Ojas Capital in Delhi/NCR. He can be reached at skukreja@investitude.co.in

Bharat 22 ETF – Allotment Status

Finance Minister in his budget speech had set Rs. 72,500 as the disinvestment target for the current fiscal year 2017-18. In order to meet this steep target, the government has decided to sell its stake in 22 of its holdings, by forming an altogether new index called “S&P BSE Bharat 22 Index”. As its name suggests, this index has been designed by the Bombay Stock Exchange (BSE) in consultation with the government. Unlike Nifty CPSE Index, which has all its constituents to be the CPSEs, Bharat 22 Index has CPSEs, PSUs and 3 private companies (L&T, ITC and Axis Bank) as its constituents.

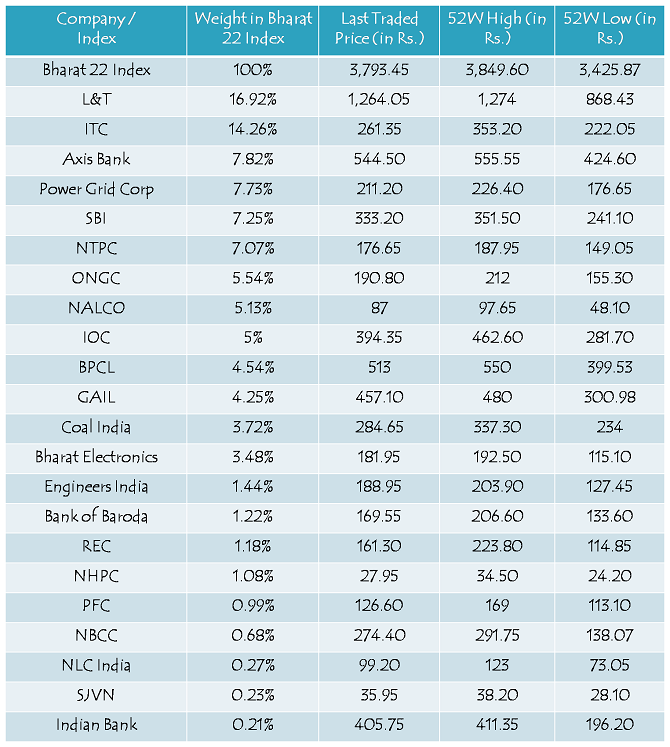
Here is the list of all its 22 constituents and their weightage in the index:

picture1

ICICI Prudential Bharat 22 ETF is an open-ended index scheme, to be listed on the stock exchanges in the form of an Exchange Traded Fund (ETF) tracking the S&P BSE Bharat 22 Index. This ETF has been launched by ICICI Prudential Asset Management Company and is named as Bharat 22 ETF.

Investment Objective – Bharat 22 ETF intends to generate returns that closely correspond to the total returns earned by the securities as represented by the Bharat 22 Index. However, the performance of the scheme may differ from that of Bharat 22 Index due to tracking error and also due to the scheme expenses.

NFO Opening & Closing Dates – This scheme will remain open for four days, only one day for the anchor investors i.e. November 14 and then three days for the non-anchor investors, including retail investors. For the non-anchor investors, it will open for subscription on November 15 and run for three days to close on November 17.

Reference Market Price/NAV – New Fund Offers, or popularly known as NFOs, normally get launched at Rs. 10 per unit as their NAV. This will not be the case with this scheme. During the NFO, each unit of this scheme will have a face value of Rs. 10 and will be issued at a premium, equal to the difference between the face value and the allotment price.

NAV of this scheme will be based on the Bharat 22 Index, and the allotment price would be approximately equal to 1/100th of Bharat 22 Index and calculated post adjusting the 3% discount offered by the government to Bharat 22 ETF for buying the underlying Bharat 22 Index shares.

3% Discount for All Investors – Investors making an investment during the offer period will be given a 3% discount on their investment. This 3% discount on the “Reference Market Price” of the underlying Bharat 22 Index shares will be offered to Bharat 22 ETF by the government of India.

Categories of Investors & Allocation Ratio

Anchor Investors – 25% of the total amount raised or 25% of Rs. 8,000 crore, whichever is higher, has been reserved for the anchor investors.

Retail Individual Investors (RIIs) – 25% of the total amount raised or 25% of Rs. 8,000 crore, whichever is higher, has been reserved for the retail individual investors also.

Qualified Institutional Buyers (QIBs) & Non-Institutional Investors (NIIs) – QIBs and NIIs too will have 25% of the issue reserved for each of their categories. In case of undersubscription in any or both of these categories of investors, unsubscribed portion will be allocated to the retail investors.

Target Amount to be Raised – The government has decided to raise Rs. 8,000 crore from this scheme. However, in case of oversubscription, the government would like to retain the whole of oversubscription in order to bridge its disinvestment target gap. So, it is highly likely that full allotment will be made to the retail individual investors.

Minimum/Maximum Investment Size – Retail individual investors can invest in the scheme with a minimum investment amount of Rs. 5,000. To remain a retail investor, the investment limit has been set at Rs. 2 lakhs.

Allotment & Listing – As per the offer document, investors will get the units allotted within 15 days from the closing date of the issue and listing on the stock exchanges will happen within 5 days from the date of allotment. However, like earlier CPSE ETF issues, I expect the allotment and listing to happen within 7-10 working days from the date the issue gets closed.

Demat Account Mandatory – As you cannot hold and trade ETFs in physical form, it is mandatory to have a demat account for you to invest in this scheme. Applications without relevant demat account details are liable to be rejected.

No Lock-In Period – As this ETF do not provide any tax benefit, there is no lock-in period for the non-anchor investors. Investors can sell their units whenever they want to do so.

Entry & Exit Load – There is no entry load to invest in this scheme and there is no exit load either as and when you decide to sell its units on the stock exchanges. You will be required to pay just your normal brokerage and other government taxes when you sell these units.

2.21% Dividend Yield – As per the BSE website, constituents of Bharat 22 Index are generating 2.21% dividend yield for its investors based on the dividends paid in the last one year. Though dividend yield is not a significant factor for me to invest in stocks or mutual funds/ETFs, I think this dividend yield of 2.21% is not too great for me to reconsider it for my portfolio.

20.28X PE Ratio – Price to earnings ratio (P/E Ratio) of Bharat 22 Index at present is ruling at around 20.28 times. If you consider Nifty to be trading at a P/E multiple of 26-27 times its trailing EPS, I think Bharat 22 Index is not too attractively valued considering most of its constituents are CPSEs or PSUs. You can only bank on their earnings recovery in order to expect a gradual rise in their share prices.

Should you invest in ICICI Prudential Bharat 22 ETF NFO?

Except 3% discount, there is nothing extraordinary in this ETF which attracts me to apply for it in this NFO. As most of its constituents are already trading close to their 52-week highs, you can consider this ETF to be trading close to its 52-week high. However, this should not be considered as anything negative for this ETF. If a stock is trading at or close to its all-time or 52-week highs, it doesn’t mean that it cannot go higher from those levels. Similarly, this ETF too has the potential to scale newer highs if its constituents continue rising as they have been in the last few months.

However, as most of these companies are CPSEs and PSUs, I think it is the government policies which are going to drive the share prices of these companies and thereby this ETF. Let us consider the decision taken by the government to recapitalise the public sector banks (PSBs) with Rs. 2.11 lakh crore worth of infusion over the next 2 years. Though it is a very positive measure announced by the government, but after all it is just an announcement and nothing concrete has taken place to actually strengthen these banks’ balance sheets and most importantly, this bank recap has done nothing to resolve the basic problems of PSBs – 1) extraordinary high levels of NPAs, and 2) poor level of accountability the managements of these public sector banks have shown over the past many years in which many of the private sector banks and NBFCs have flourished to higher levels over the opportunities lost by these PSBs.

Still, this announcement of bank recap has resulted in 36% returns in Nifty PSU Bank Index since Muhurat Trading on Diwali, from 2942.7 on October 19 to 4001.45 on November 10. What I want to say here is that if just an announcement of doing something good for the health of the public sector enterprises or overall economy can deliver such high returns in such a short period of time, then I think nobody has truly imagined the actual potential of these CPSEs and PSUs if the government honestly gets serious with its duty to run these companies professionally. If you trust the intentions and policy execution capabilities of the Modi government, then only this ETF is worth investing your money at these levels, or otherwise, go for the diversified equity mutual funds.

ICICI Prudential Bharat 22 ETF Application Form

HDFC Life IPO Review – Should You Invest or Not @ Rs. 275-290?

This post is written by Shiv Kukreja, who is a Certified Financial Planner and runs a financial planning firm, Ojas Capital in Delhi/NCR. He can be reached at skukreja@investitude.co.in

HDFC Life Insurance IPO Details

Finalisation of Basis of Allotment – On or about November 14, 2017

Initiation of Refunds – On or about November 15, 2017

Credit of equity shares to investors’ demat accounts – On or about November 16, 2017

Commencement of Trading on the NSE/BSE – On or about November 17, 2017

Peer Comparison

picture1

Financials of HDFC Standard Life Insurance Company Limited

picture2

(Note: Figures are in Rs. Crore, except per share data & percentage figures)

As far as insurance business is concerned, HDFC has never been an aggressive player and probably that is why it is not the market leader. With HDFC Life, there are certain things which are positive and there are certain things in which it lags other players in the industry. It recorded highest growth in AUM among top five private players listed in the table above in the last 5-year period. Also, the company reported the highest claim settlement ratio among these players at 99.16%. However, as far as operating cost and persistency ratios are concerned, it lags both its listed peers, SBI Life and ICICI Prudential. The company has operating cost ratio of 12.6% as compared to SBI Life’s 8% and ICICI Pru’s 10.7%. But, Max Life has it at 15.7% and Bajaj Allianz even higher at 18%.

During FY 2016-17, HDFC Life reported total income of Rs. 30,554 crore as against Rs. 18,210.23 crore in FY 2015-16, profit after tax (PAT) of Rs. 886.92 crore vs. 816.79 crore and diluted EPS of Rs. 4.42 vs. Rs. 4.09. During the half year ended September 30, 2017, the company managed to generate total income of Rs. 14,415 crore, PAT of Rs. 554 crore and diluted EPS of Rs. 2.76. As on September 30, 2017, the company has a net worth of Rs. 4,464 crore and book value of Rs. 22.3 per share. At Rs. 290 a share, the company will be valued at a PE of 65.61 times based on its FY 2016-17 earnings, 52.54 times its annualised EPS of Rs. 5.52 for FY 2017-18 and 13 times its latest book value. To me, these are again stretched valuations by any standards.

As per the latest report issued by Milliman Advisors LLP, HDFC Life has an embedded value of Rs. 14,011 crore as on September 30, 2017. At Rs. 290 a share, the company will have a market capitalisation of Rs. 57,994 crore, and will be valued at 4.14 times its embedded value. As compared to HDFC Life, ICICI Pru and SBI Life are currently valued at 3.25 times and 3.63 times their embedded values respectively. So, as far as valuation based on embedded value is concerned, HDFC Life is seeking a premium over SBI Life and ICICI Pru.

These are not cheap valuations and therefore I think leave nothing great for the investors to make on the listing day. However, it is the HDFC brand which is going to support these high valuations and therefore I think it should list within a close price band of +/- 5%. This IPO is for the long term investors and therefore I think it should move in tandem with other HDFC group companies. Only investors with a long term view should apply and others should avoid this IPO.

HDFC Life IPO Details

This post is written by Shiv Kukreja, who is a Certified Financial Planner and runs a financial planning firm, Ojas Capital in Delhi/NCR. He can be reached at skukreja@investitude.co.in

HDFC Life IPO Review – Should You Invest or Not @ Rs. 275-290?

After tepid listings of SBI Life and GIC Re, it is now the turn of HDFC Life to get itself listed on the stock exchanges with its initial public offer (IPO) of Rs. 8,695 crore. The issue is getting opened for subscription from tuesday, November 7 and will remain open for three days to close on November 9.

Like most of the IPOs in bull markets, this IPO too involves sale of stake by its existing promoters. HDFC is selling its 9.52% stake and Standard Life (Mauritius Holdings) is selling its 5.4% stake in this IPO. Post this issue, HDFC’s stake in the company will fall from 61.21% to 51.69% and Standard Life’s stake will fall from 34.75% to 29.35%.

The company has fixed its price band in the range of Rs. 275-290 a share and no discount has been offered to the retail investors. The offer would constitute 14.92% of HDFC Life’s post-offer paid-up equity share capital.

Here are some of the salient features of this issue:

Size & Objective of the Issue – HDFC and Standard Life (Mauritius Holdings) are collectively selling their 14.92% stake in HDFC Life in this IPO to raise Rs. 8,695 crore. HDFC Life will not get any proceeds from this offering.

Price Band & Retail Discount– HDFC Life has fixed its price band to be between Rs. 275-290 a share and the company has decided not to offer any discount to the retail investors.

Retail Allocation – 35% of the issue has been reserved for the retail individual investors (RIIs), 15% for the non-institutional investors (NIIs) and the remaining 50% shares will be allocated to the qualified institutional buyers (QIBs).

Reservation for HDFC Shareholders & HDFC Life Employees – HDFC Life has reserved 2.998 crore shares for the existing shareholders of its parent company HDFC, 21.45 lakh shares for the HDFC Life employees and 8.05 lakh shares for the employees of HDFC.

Bid Lot Size & Minimum Investment – Investors need to bid for a minimum of 50 shares and in multiples of 50 shares thereafter. So, a retail investor would be required to invest a minimum of Rs. 14,500 at the upper end of the price band and Rs. 13,750 at the lower end of the price band.

Maximum Investment – Individual investors investing up to Rs. 2 lakh are categorised as retail individual investors (RIIs). As a retail investor, you can apply for a maximum of 13 lots of 50 shares each @ Rs. 290 a share i.e. a maximum investment of Rs. 1,88,500. At Rs. 275 per share, you can apply for 14 lots only of 50 shares, thus making it Rs. 1,92,500.

Listing – The shares of the company will get listed on both the stock exchanges i.e. National Stock Exchange (NSE) and Bombay Stock Exchange (BSE) within 6 working days after the issue gets closed on November 9. Its shares are expected to get listed on November 17.

Here are some other important dates as the issue gets closed on November 9:

Finalisation of Basis of Allotment – On or about November 14, 2017

Initiation of Refunds – On or about November 15, 2017

Credit of equity shares to investors’ demat accounts – On or about November 16, 2017

Commencement of Trading on the NSE/BSE – On or about November 17, 2017

Peer Comparison

picture1

Financials of HDFC Standard Life Insurance Company Limited

picture2

The New India Assurance Company IPO Review

This post is written by Shiv Kukreja, who is a Certified Financial Planner and runs a financial planning firm, Ojas Capital in Delhi/NCR. He can be reached at skukreja@investitude.co.in

New India Assurance IPO Details

Should you invest in New India Assurance IPO or not @ Rs. 770-800?

picture2

During the financial year 2016-17, New India Assurance reported Gross Written Premium of Rs. 23,230 crore, up 20.82% against previous year’s Rs. 19,227 crore. However, Gross Written Premium is the only area in which the company registered some kind of growth, as the company failed to perform on all other parameters. The company reported an operating loss of Rs. 901.37 crore as against Rs. 533.43 crore loss it had in FY 2015-16. Its profit after tax (PAT) was also down 9.72% at Rs. 839.86 crore as against Rs. 930.35 crore in 2015-16.

Combined Ratio stood at 119.73% (vs. 117.97% in FY 2015-16) and Solvency Ratio was at 2.22 times (vs. 2.46 times in FY 2015-16). Combined Ratio of 100 or above indicates that the company is incurring losses in its core insurance business. As far as Return on Net Worth (RoNW) is concerned, it has fallen from a high of 12.32% in FY 2014-15 to almost half at 6.81%.

Recently listed ICICI Lombard is the only listed company with which we can compare NIA’s pricing and valuations, and NIA lags ICICI Lombard in almost all the parameters except Solvency Ratio. Firstly, NIA’s market share has declined from 15.6% in FY 2014-15 to 15% in FY 2016-17, whereas ICICI Lombard has been able to increase its pie from 7.9% in FY 2014-15 to 8.4% in FY 2016-17. HDFC Ergo and IFFCO Tokio too have gained on their respective market shares. Moreover, ICICI Lombard reported far better Combined Ratio (104%), Loss Ratio (80.4%) and Expense Ratio (23.6%) as compared to NIA for which these ratios stood at 118.7%, 91.3% and 27.4% respectively during the same period.

Peer Comparison

picture3

As far as its pricing is concerned, NIA is seeking a valuation of 74.63 times its trailing EPS of Rs. 10.72 and 4.88 times its book value of Rs. 164.04 as on June 30, 2017. The company showed a surprisingly remarkable turnaround in the first quarter of the current financial year and reported an EPS of Rs. 6.29 a share, based on which the PE ratio it is seeking has fallen to 31.8 times its annualised EPS of Rs. 25.16. However, looking at its declining or inconsistent performance in the past, I have a serious doubt over sustainability of this turnaround and that is why I don’t think the company deserves such high valuations. At these high valuations, I would personally avoid this IPO and invest my money with better managements and bankable businesses.

New India Assurance IPO Details & Review – Should You Invest or Not @ Rs. 770-800?

This post is written by Shiv Kukreja, who is a Certified Financial Planner and runs a financial planning firm, Ojas Capital in Delhi/NCR. He can be reached at skukreja@investitude.co.in

After divesting its stake in GIC Re, the government has placed its stake on sale in its 99.99% subsidiary, The New India Assurance Company Limited, through its initial public offer (IPO) of Rs. 675 crore. The issue is getting opened for subscription from today, November 1 and will remain open for three days to close on November 3. The IPO is a mix of fresh issue of 2.40 crore shares by the company and an offer for sale (OFS) of 9.60 crore equity shares by the Government of India.

The company has fixed its price band in the range of Rs. 770-800 a share and a discount of Rs. 30 a share will be given to the retail investors and eligible employees of the company. The offer would constitute 14.56% of the company’s post-offer paid-up equity share capital.

Here are some of the salient features of this issue:

Size of the Issue – This IPO is a combination of an offer for sale (OFS) of 9.60 crore shares by the Government of India and a fresh issue of 2.40 crore shares, which makes it a Rs. 9,467 crore IPO at the upper end of the price band of Rs. 800.

Price Band – New India Assurance has fixed its IPO price band to be between Rs. 770-800 a share and the company has decided to offer a discount of Rs. 30 a share to the retail investors, as well as its eligible employees.

Retail Allocation – 35% of the issue has been reserved for the retail individual investors (RIIs), 15% for the non-institutional investors (NIIs) and the remaining 50% shares will be allocated to the qualified institutional buyers (QIBs).

Rs. 30 a share discount for Retail Investors & Employees – The company has decided to offer a discount of Rs. 30 a share to the retail individual investors and its eligible employees.

Reservation for Employees – The company has decided to keep 36 lakh shares worth Rs. 277.20 crore reserved exclusively for its employees.

Bid Lot Size & Minimum Investment – Investors need to bid for a minimum of 18 shares in this offer and in multiples of 18 shares thereafter. So, a retail investor would be required to invest a minimum of Rs. 13,860 at the upper end of the price band and Rs. 13,320 at the lower end of the price band.

Maximum Investment – Individual investors investing up to Rs. 2 lakh are categorised as retail individual investors (RIIs). As a retail investor, you can apply for a maximum of 14 lots of 18 shares each @ Rs. 770 a share i.e. a maximum investment of Rs. 1,94,040. At Rs. 740 a share, you can apply for a maximum of 15 lots of 18 shares, thus making it Rs. 1,99,800.

Listing – The shares of the company will get listed on both the stock exchanges i.e. National Stock Exchange (NSE) and Bombay Stock Exchange (BSE) within 6 working days after the issue gets closed on November 3rd. Its shares are expected to get listed on November 13th.

Here are some other important dates as the issue gets closed on November 3:

Finalisation of Basis of Allotment – On or about November 8, 2017

Initiation of Refunds – On or about November 9, 2017

Credit of equity shares to investors’ demat accounts – On or about November 10, 2017

Commencement of Trading on the NSE/BSE – On or about November 13, 2017

Financials of The New India Assurance Company Limited

picture2

(Note: Figures are in Rs. Crore, except per share data & percentage figures)

Should you invest in New India Assurance IPO or not @ Rs. 770-800?

During the financial year 2016-17, New India Assurance reported Gross Written Premium of Rs. 23,230 crore, up 20.82% against previous year’s Rs. 19,227 crore. However, Gross Written Premium is the only area in which the company registered some kind of growth, as the company failed to perform on all other parameters. The company reported an operating loss of Rs. 901.37 crore as against Rs. 533.43 crore loss it had in FY 2015-16. Its profit after tax (PAT) was also down 9.72% at Rs. 839.86 crore as against Rs. 930.35 crore in 2015-16.

Combined Ratio stood at 119.73% (vs. 117.97% in FY 2015-16) and Solvency Ratio was at 2.22 times (vs. 2.46 times in FY 2015-16). Combined Ratio of 100 or above indicates that the company is incurring losses in its core insurance business. As far as Return on Net Worth (RoNW) is concerned, it has fallen from a high of 12.32% in FY 2014-15 to almost half at 6.81%.

Recently listed ICICI Lombard is the only listed company with which we can compare NIA’s pricing and valuations, and NIA lags ICICI Lombard in almost all the parameters except Solvency Ratio. Firstly, NIA’s market share has declined from 15.6% in FY 2014-15 to 15% in FY 2016-17, whereas ICICI Lombard has been able to increase its pie from 7.9% in FY 2014-15 to 8.4% in FY 2016-17. HDFC Ergo and IFFCO Tokio too have gained on their respective market shares. Moreover, ICICI Lombard reported far better Combined Ratio (104%), Loss Ratio (80.4%) and Expense Ratio (23.6%) as compared to NIA for which these ratios stood at 118.7%, 91.3% and 27.4% respectively during the same period.

picture3

As far as its pricing is concerned, NIA is seeking a valuation of 74.63 times its trailing EPS of Rs. 10.72 and 4.88 times its book value of Rs. 164.04 as on June 30, 2017. The company showed a surprisingly remarkable turnaround in the first quarter of the current financial year and reported an EPS of Rs. 6.29 a share, based on which the PE ratio it is seeking has fallen to 31.8 times its annualised EPS of Rs. 25.16. However, looking at its declining or inconsistent performance in the past, I have a serious doubt over sustainability of this turnaround and that is why I don’t think the company deserves such high valuations. At these high valuations, I would personally avoid this IPO and invest my money with better managements and bankable businesses.