OneMint by Numbers

There hasn’t been a post on the site for the last couple of days because OneMint has now moved from a shared web host to a VPS (Virtual Private Server) and I had to stop posting while that work was going on. This was triggered because of a notification from my web host about high email traffic that they were seeing.

They emailed me late Sunday to tell me that 1,882 emails were sent out within the last hour and that this high number shows spam. They sent me a few sample emails and I quickly realized what’s going on. About 144 people are subscribed to the notification that is sent out on the Suggest a Topic page, and if there are 1o comments on that post then 1,440 emails will be sent out due to just that post.

The site has grown quite a bit in the last couple of years and I thought I’d do a post with some numbers that I found interesting while looking at the stats during the last couple of days.

Email Subscribers

First, a number that is regularly visible to everyone – the number of email and feed subscribers – the site has a total of 8,512 subscribers as I write this and while this is visible to everyone, what’s probably not so apparent is that this number could have easily been in excess of 20,000 by now.

For a brief time, I used a plugin that blacks out the screen when someone visits the site for the first time and shows them a subscription box. That plugin is really very effective in capturing subscribers and gives you a massive bump in subscribers. I used it for some time and based on the amount of visits and conversions – there would’ve been more than 20,000 subscribers on the site today.

However, it just didn’t feel right to use that plugin because of the way it captures subscribers. How can a first time visitor really give you their email address because they really don’t know about the quality of the site and whether it is a good fit for them or not. They are just doing it because they want to get to the content and I’ve always had mixed feelings about it, and one day my wife complained about it and I said enough – get rid of this thing.

I’d not recommend anyone else to get rid of it – that thing really works, and it doesn’t harm any other statistic of the site so if you go by numbers you should definitely use that plugin. You need to keep a balance between your site’s needs as well as reader’s needs and I don’t think using this plugin is so bad for readers that you should get rid of it. After all, it’s just shown to first time readers, and people can always unsubscribe or report you to spam if they don’t like the content.

Total Posts

There are a total 1,237 posts on this site (including this one) – and that’s one number that really amazes me when I think about it.

Total Comments

OneMint has one of the most engaged, smart reader base about Indian personal finance that’s to be found anywhere on the web. The quality of the comments is such that in many posts the comment threads are a lot more useful than the post itself and at 14,355 comments – the total number of comments is pretty decent as well.

Most Comments On a Single Post

There are a few posts with over 100 comments, but the most comments by far is on the Suggest a Topic page. The topic suggestions here have been overwhelming for me and I’ve not been able to write about everything that’s suggested but it’s pretty amazing how many people have commented there and the range and diversity of the topics. At 664 comments, that page has the maximum comments.

Most Facebook Likes on a Single Post

At 1,953 Likes – the post on Sachin’s centuries and India’s losses has the maximum Facebook likes. This was an amazing post that I really enjoyed researching, creating and then getting feedback on. In fact, I was at a party recently, and people were quoting numbers from this post without knowing that I had written it – I was truly amazed by that.

Most Pageviews in a Month

The biggest traffic month for the site was January of this year when the site clocked 391,553 page – views. It was crossing 300,000 for quite a few months before that but had never been so close to 400,000 before. I think that’s a fairly size-able number for any blog, and I won’t be surprised if OneMint’s traffic is among the top 3 of any Indian personal finance blog, and as someone told me last year it is by far the biggest by someone who is not in the business.

I’m not sure how many of you would’ve guessed these numbers about OneMint, and I’ve always felt that people don’t realize how much traffic the site gets or it may just be that my idea of big traffic is different from most other people.

After all, these numbers are probably just a hundredth of what Economic Times gets. Or it could be because the posts are not as high a quality as other websites and as someone commented once, sometimes they are a repetition of what can be sourced elsewhere on the web.

Regardless, the one big thing I’ve learned about blogging is that you don’t write because you like to write, you write because you like being read.

If there weren’t as many comments, and discussions on the site as there are today, I would’ve probably quit a long time ago. I hope you find value out of OneMint, and thank you very much for reading and leaving all these wonderful comments!

How can Goa manage to reduce petrol price by Rs.11?

I was amazed to read that Mr. Manohar Parrikar has promised to reduce the price of petrol in Goa by Rs. 11 and I was really curious to see how he managed this, and how big a hole this will put in the State’s finances.

The way he has managed this Rs. 11 reduction is by abolishing (almost) the VAT on petrol which used to be 20%. This is now only 0.1% and it has not been brought down to zero so as to maintain sales records.

The thing that amazed me most was that this step will not lead to a revenue loss but the Goa government is actually projecting an increased realization of Rs. 470 crores from VAT, Entertainment Tax, Luxury Tax, and Entry Tax!

The source of this information is the budget speech document (pdf) and I don’t know how far these projections have been accurate in the past but they have raised the rates on a whole host of other things in order to plug the loss from the reduction in VAT.

From the budget document, here are the things on which taxes have been increased.

Value Added Taxes

195 VAT on IMFL (Indian Made Foreign Liquor) and Beer to be increased from 20% to 22%.

196 VAT on Carbonated beverages (Coke, Pepsi etc.) increased from 12.5% to 20%.

197 VAT on junk food and fast food increased to 20%. (Not mentioned how much it was earlier)

198 Levy a tax rate of 15% on cars and SUVs sold at more than Rs. 15.00 lakhs. Same thing is applicable on bikes that cost more than Rs. 2 lakhs.

199 Levy 5% VAT on textile fabrics.

200 Entry tax on Naptha increased from 12.5% to 15%.

202 Tax on cigarettes increased to 22%.


Entertainment Tax

211 Entry fee on casinos reduced from Rs. 2,000 to Rs. 500 but the license fee increased to Rs. 6.5 crores – these two measures are expected to net themselves out.

213 Entertainment tax on casino games to be increased from 10% to 15%

Luxury Tax

214 Space being rented out for use of commercial activities to be brought under the ambit of luxury tax at the rate of 5%.

215 Services provided in a beauty parlor or spa to be covered under luxury tax of 10%.

Entry Tax

218 Raise the rate of entry tax on coal and coke to 2%.

219 Increase the rate of entry tax on SUVs and bikes which exceed Rs. 15 lakhs and Rs. 2 lakhs to 15%. I’m not quite sure whether this is in addition to the 15% VAT.

Conclusion

220 The effect of all this is that they expect to raise additional revenue by Rs. 470 crores.

Please note that this is not a complete list of all the items and I’ve excluded some other items like Gensets – the rates on which have also gone down. I’ve done that because I was primarily interested in seeing what rates they have increased to manage this extra Rs. 470 crores.

I must emphasize again that these are the only numbers I’ve seen, and this is the first time I’ve seen such a thing so it is possible that I may have missed an increase mentioned in the document which turns out to be quite important. Also, I’ve not seen the absolute numbers for any of these items as it was last year so it is hard for me to say how realistic this additional realization really is.

If you have any knowledge on that – fire away!

Reader Stories: Rohan Doshi’s Investing Journey

Rohan left a comment on the first post about investing for beginners about how much that post resonated with his experience, and I asked him if he’d be interested in sharing his story.

He responded to me last week, and here’s what he had to say (with minor editing).

First, a bit about me.

Age: 26 Years
Education: Computer Engineer
Current Job Role: Senior Software Engineer
IT Experience: 5 years 8 Months
Project: Derivatives Product Control
Marital Status: Married

Story :

Phase 1 Beginnings

I started my investment career when I joined HSBC on 24 July 2006, had a habit of investing minimum 10,000 every month since my 1st salary. I used to invest all that in stock market (I know it’s too bad to jump too early into this without much knowledge, but I really some how got attracted to it due to my gujju blood may be 🙂 )

I also did a 7 day stock market class in Pune for better understanding and gave 3-4 NCFM exams including derivatives one.

By the end of 2007  I had invested Rs. 3,30,000 in the stock market (including 50% mom’s amount) and total output value was Rs. 5,20,000.
Most of my investments were done based on my internet search / local broker tip / IPOs etc. It’s too bad that I didn’t sell anything at the time , because I had never heard of selling the stocks till then, and waited for them to go up , up and up 🙁

Phase 2 Bubble Burst

In Jan 2008 came the Reliance Power IPO with much hype, and I got carried away and filled 2 applications of 1 lakh and rest we all know 🙁

After that I didn’t invest in a single stock and as I said I was just witnessing all investments value getting reduced day by day.

I lost confidence in stock market at that time and got distracted from it for next 2 years or so.
I wasn’t even reading any financial articles or talking about it to my friends 🙂
It’s just that in 2010, stock market was on recovery mode and I also needed money for my marriage so I sold most of my investments.

Phase 3 Marriage

I got married in Dec 2010 and since then I felt the need to start investment again for my family’s secure future.

As I had already burned my hands in the 2008 crash, I was sure that I will not take that route. By now, I had realized that it’s not possible to concentrate on day trading till I do my day job.
So this time I decided to take mutual funds SIP route and started searching for good mutual funds with track records.

Around similar time (March 2011), I found out about your’s and Hemant’s blog through internet and got attracted to it.

Then I had gone through many of articles from both of your websites and got convinced that only mutual funds SIP is not sufficient and what I need is complete financial planning. But only thing that was stopping me from doing it was fees for financial planning. This financial planning concept is still very new in our country and to pay for the advice is something for which I was having hard time to convince myself.

Later around April 2011 , Hemant announced the scheme of complete financial planning in 10k and at that moment I decided that this is time I should go for it.

I called him and we had discussion about the current situation and my requirement. Within span of 2 months, we completed all the formalities and I shared maximum information about my financial life to him.

He had plan ready for me and once we agreed to it then we started the implementation on it since Jun 2011. I can say that it is very good plan made by him, catering to all my objectives. It covers retirement planning, goal planning (child education, child marriage, vacations, car purchase , insurance planning).
Also he divided all the goals into 3 categories like short term, medium term and long term for my better understanding.

So I am very happy with this phase right now and planning to continue in it for long long time.

About stock market, I still have fascination about buy/sell of stocks but I have decided to gain lot of knowledge about its nuances before i jump again and that too with amount which i can afford to loose.
Also currently I am also pursuing the MBA from ICFAI and into its last stage , its my company sponsored program and i have taken it to enhance my knowledge about finances.

So, this was my story starting diving deep in the market to taking a very planned approach. What do you think of it? Does it sound familiar to your story at all?

Part 2: How should beginners approach investing in the stock market?

In part 1 of this series, I wrote about how most people get hooked to the stock market and how they evolve through the various stages of a speculator / investor.

I closed that post summing up my preference for long term investing, and in this post I’m going to write about two things that I feel are particularly important. First is an implicit assumption that long term investors make and second is how you should view a share or a mutual fund.

I think it bears mentioning that there will be a third part of this series as well.

The Assumption

If you are a long term investor you should recognize that there is an implicit assumption in what you’re doing, and that implicit assumption is that over the long term the stock market will go up.

The stock market is a barometer of the economy, and if the GDP rises then the stock market indices will also rise with it. About a year ago, Mr. Mukesh Ambani said that Indian nominal GDP could cross $30 trillion by 2030, and if the economy were to roughly grow at 15% – 16% in the next 20 years – I think the target will be met. Now, remember this is the nominal GDP growth rate (which doesn’t take into account inflation) and not the real GDP growth rate and that’s why it sounds high, but in reality this is close to the nominal growth we see today.

So, if the economy were to grow to 15 times its size in the next 20 years, you can expect the stock market to grow along those lines as well. There won’t be a perfect correlation, but if the economy grows then the stock market should rise as well.

By and large most stock markets have shown this to be possible, but there are exceptions like Japan whose stock market is just 20% of what it was 30 years ago and then there are long periods of time when the Dow didn’t move anywhere at all.

In India’s context, I think the risk is more political than anything else. If the political class doesn’t screw up policies and business environment then this growth should be attainable. From recent experience, we know that they are capable of screwing it perfectly well.

It’s important to understand that long term investing does rest on this assumption because if you don’t understand this then you can be lulled into thinking that the market will always go up no matter what so it is safe to have all of your cash in the stock market. There is no guarantee that the market will always go up so it is best to have a portfolio that is diversified between shares and fixed income products.

The next thing that I think is important from the perspective of a long term investor is to understand the nature of a stock or share – to know what is it that you are buying or selling.

What is a share?

Long term investors and traders view a stock or share very differently. While traders are more concerned with the price and volume action of the stock, long term investors are concerned about the underlying business of the company.

They view the share as part ownership in the company and the correlation in their mind is between earnings and share price. If the company continues to grow profits many years down the line then the stock price will also rise to match that growth.

If you think of stocks like this you will start thinking of expensive or cheap stocks with relation to the money they make. So, when you look at a company you will think in terms of how much money the company makes (earnings or free cash flow) and how much it is selling for (market capitalization) and base your value decision on that.

A lot of investors will never buy individual stocks and there’s good reason for that but even then you need to be able to view stocks in this way to stomach the inevitable volatility that exists in the market. This outlooks helps stomach volatility because when the market falls by 20% or 30% in a short period of time you are able to look at the earnings of the companies whose shares have fallen and say to yourself, surely this company will not go bust and the stock price will not go to zero.

I believe this kind of outlook helps people deal with the volatility that has been part of the Indian markets for very long and will most likely continue to exist in the future as well.

Even if you buy mutual funds – it is the same thing since a mutual fund in turn holds shares and it is nothing but a representative of the value of the shares that the fund holds.

This of course is not true if you’ve been buying penny stocks or hot stocks which can go down very fast, and then never recover, but if you have been steadily buying decent stocks over a long period of time then this will hold true.

So, to sum it up, long term investors do rely on the somewhat obvious (even if unspoken) assumption that in the long run, the market will move upwards and you have to view a share as part ownership in the company to be able to truly appreciate what you are buying.

Next, Monday I’ll have the third part of this series and if you haven’t read the first part which deals with how people get hooked to the markets and how they evolve through different stages, then I recommend you read that as well.

2012 Budget: Where does the government spend your money?

Earlier in the week I looked at how the government raises money, and in this post I’m going to look at a few charts on how the government spends its money.

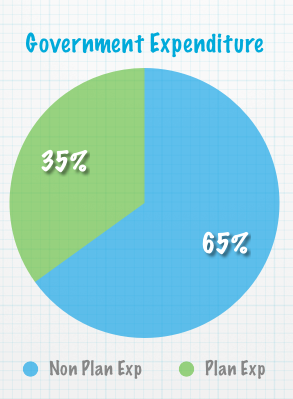
There are two heads of government spending – Non Plan Expenditure and Plan Expenditure. Non Plan Expenditure is money that’s spent on sustaining the country like defense, postal deficit, subsidies etc. and Plan Expenditure is the money that is spent on improving the country like the money spent on dams, roads etc.

It won’t surprise you to learn that a lot more is spent on sustaining ourselves than is spent on improving the infrastructure etc. and here is a pie chart that shows how this ratio is expected to look like in 2012.

Government Expenditure Plan and Non Plan

The absolute numbers for this is Rs. 9,69,920.90 crores of Non Plan Expenditure and 5,21,025.00 crores of plan expenditure.

But if the government spends so much on sustaining us – where does that money go?

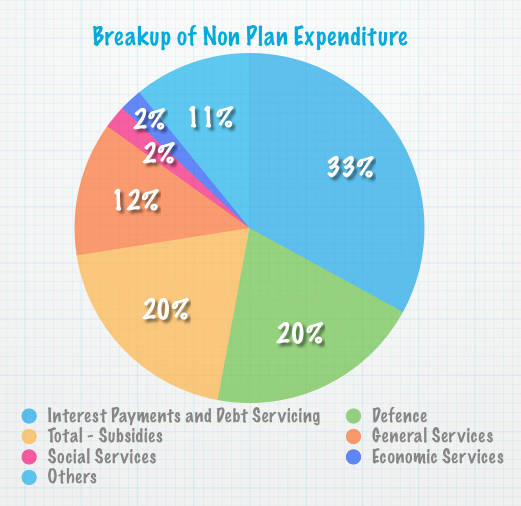
Here is a pie chart that shows the spending on the major non plan expenditure heads.

Breakup of Non Plan Expenditure

This chart would probably surprise people who see this break up for the first time, but others would know that a large part of the spending goes in making interest payments of the debt that we’ve accumulated over the years, and the next biggest head is Defense of course.

Here are the absolute numbers.

Heads Rs. In Crores
Interest Payments and Debt Servicing  319,759.43
Defence  193,407.29
Total – Subsidies  190,015.13
General Services  120,086.08
Social Services  20,784.13
Economic Services  20,479.24
Others  105,368.99
Grand Total  969,900.29

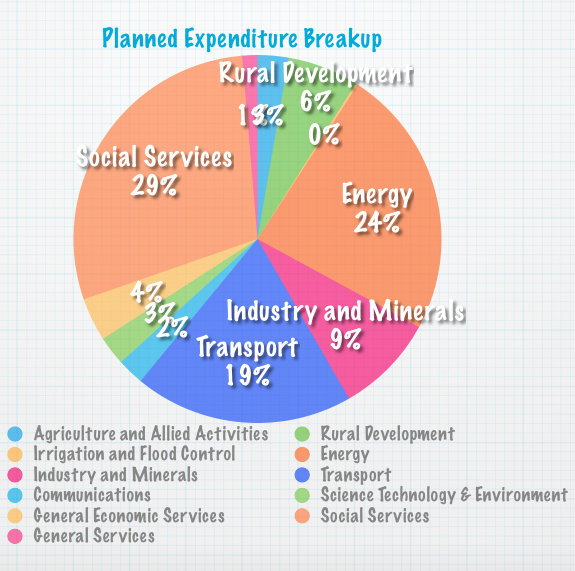
Now, let’s move on to plan spending. Here is a pie chart with the break up on the plan spending.

Planned Exp Breakup
Planned Exp Breakup

The big spend here is Social Services and that comprises of a lot of items under broad heads like Education, Health, Housing, Art and Culture, Water Supply etc.

Here are the absolute numbers.

Agriculture and Allied Activities 17692.37
Rural Development 40763.45
Irrigation and Flood Control 1275.00
Energy 154841.94
Industry and Minerals 57226.76
Transport 125357.06
Communications 15411.38
Science Technology & Environment 16591.65
General Economic Services 24777.28
Social Services 188871.69
General Services 8700.67
Grand Ttotal 651509.25

I think perhaps the biggest thing to take away from this post is how nothing is free and how money that’s used to subsidize oil has to be later borrowed which then accrues interest on it and then paying that interest eats up into money that you could use to finance growth.

How to buy health insurance in India?

This is a guest post by Mahavir Chopra, Head – eBusiness & Retail, http://www.Medimanage.com

Being a part of health insurance services company I have always noticed that there are large number of people, who at first show keen interest in buying Health Insurance services, but after they are recommended some of the best suitable health insurance policies, they suddenly just disappear. Intrigued by this, we did a detailed internal analysis and a customer survey, and we realized that most people, including some of the brightest professionals, delay their decision/action to buy, primarily due to 3 reasons:

a) The product has no instant gratification or compulsion to buy.

b) Expectation of a perfect match to their requirements (and)

c) Due to over exposure to multiple product features, advertisements, and promotions.


Our Internal Customer survey done with Medimanage.com customers, revealed that point c) is an important external influence on the decision making process of the health insurance buyer. To-be consumers are confused with multiple products, from various brands, and hence delay their decision on purchase of a health cover, till they can find a recommendation or reference they can depend and rely on. We cannot blame the general customer, as we are aware, and you would agree, that buying Health Insurance is far more long term than buying the latest Widescreen LED Television, and far more complicated than buying a standard term insurance.


The over exposure of products has been aptly termed ‘The paradox of choice’ by Barry Schwartz, a social scientist, in his book with the same name. He says, “Unlimited choice results in genuine suffering. The more choices we have to make, the less certainty we seem to have. When we have 285 kinds of cookies to choose from in the grocery store, how can we be sure we’ve picked the right one? And that’s just cookies. When faced with seemingly unlimited choices that have significant consequences like which stocks to invest in, which career to pursue or even which person to marry, many people become ‘maximizers’: people who relentlessly search for the best option. These people spend a great deal of time and energy on choices that will never satisfy them.”


Personally, as a buyer, it’s very clear and almost a fact for me, that more product offerings in the market, topped with more promotions, more advertising, are only complicating things, and delaying decisions specially and importantly, when buying products or services, I “need”, but don’t have a strong “want”.


So, coming to the million-dollar question, how does one sift through a minimum of 50 health insurance policies and variants and zero in on the best health insurance suitable for his/her family? My answer is quite simple; you need to first, right in the beginning, understand that buying a long-term product like Health Insurance is like getting married. The younger you are, you will have more choice, but there never will be a perfect match for your requirements. You cannot keep waiting for the best product, because there isn’t one.

What you need to look for is the most suitable product, rather than a perfect match, here’s how.

1.    Do a thorough need analysis:

To find a product, which is most suitable to your needs, you need to understand your needs first.

  • The family members you want to cover. The more members, the higher the age, and the higher the coverage you need.
  • The city where you live, and where you are likely to take hospitalization treatment. If these cities are in the northern or western metros (like Delhi, NCR, Mumbai, Ahmedabad etc.) you need more coverage.
  • Your choice of type of hospitals you want. Would you prefer treatment in a neighbouring nursing home, which has a personal touch or would you always prefer a large corporate hospital for the smallest of treatments. If you are expected to use mega hospitals, for all kinds of smallest treatments, you would need a larger sum insured, for sure.
  • Similarly, the choice of room you want, would impact the kind of policy suitable to you. If you are used to private, deluxe AC rooms. The best test for this is, if you had no insurance today, and if any of your family has unfortunately been hospitalized, would you take a private room, or settle for a shared room? This type of room is your real choice, without financing from an insurance policy.
  • Your long-term plans would affect the kind of product, and coverage you would need. For instance, are you/any member in the family planning to migrate abroad etc.?
  • What is the amount of expense on Healthcare you can bear on your own savings?

2.    Recruit a Good Advisor

There are too many general “tips”, “guides”, and other noise about Health Insurance today. If you are looking for unbiased advise to choose the best Health Insurance policy suitable to you, you need to take pain in finding a good health insurance advisor (preferably a broker, who can provide wide spectrum of product options), one who can provide you genuine advise, service the policy, and also has experience in managing health insurance claims. The claims management part is very crucial, as Health Insurance claims can have a lot of back and forth, and get tedious at times, and hence requires professional help. A good advisor plays the role of a linchpin in a complex service and product like Health Insurance, across the life of the policy.

(Full Disclosure: The writer of this blog post works for a Health Insurance Advisory Broker Firm)


3.    The younger you are, the more choices you have.

Like marriage, the younger you are, you have larger spectrum of choice, and hence you can get choosy about the most suitable product. The older you get your choices narrow. Once an ailment kicks into the health of any of your family members, the choice can become minimal to one or two products. If you were diligent enough, choosing and buying Health Insurance, when you don’t need it, would provide the widest health cover possible.

4.    There is no Perfect Match

As mentioned earlier, there is no perfect match, and hence, waiting for ever to find the perfect fit to your requirement, may prove hugely futile. After detailed understanding of your needs, and taking sound advise, you need to settle with a good but imperfect product. There is no point waiting for “that important feature” in the product. What’s more, if such product does appear in due course, you can always port the same, with proper planning in place.

5.    The Real thing – look beyond the looks

I am a great movie buff, and after some experience, I observed that today, with strong marketing geniuses around, all films look good, till one week after the release. That’s when the realities and reviews sink :). Health Insurance is no different. Packing old wine in new bottle is an art, many have mastered. Its important to do a core need analysis, and purchase a product/service, that meets these core needs. Anything over and above this is either packaging, or, bonus (if it comes at a similar price.)

6.    Look Long term

Look really long term. Understand that Healthcare inflation in India is rocketing through the roof, and hospital bills are becoming more and more unmanageable without financing solutions like Health Insurance. You need to realize that if you are 30 today, you will most probably need health insurance the most maybe in 15-20 years. You need to factor these inflated costs and then look at an optimum coverage.  Do not settle for a coverage or sum insured, based on current costs of hospitalization.

7.    Understand the *

I know it’s a tad boring to read the fine print, called the policy wordings document. But when you are buying a product, which is a solution, for 20+ years, you need to take that pain. If you cannot understand the legal and medical language, you can always ask a health insurance expert advisor to take you through every part of the policy. The wordings will give you a flavour of how the product actually works, and what problem it solves, and does not solve.

8.    Meet the Parents

It’s important to meet the parents, and understand the background. Knowing the basic reputation of the group and joint venture partner behind the product is critical for a long-term financial product. It reflects how the company will react, specially, in downturns in the industry or its own company.


Unarguably, Health Insurance is a critical piece in your financial jigsaw puzzle. Taking the above-suggested points into consideration, apply your own judgement and common sense, take a personal deadline, and take the proverbial “leap” of faith.  Believe me, you will not go wrong, till you act quickly, and take a call.


In case you have any questions, or feedback or comments, do share the same in the comments below. I am also available at the email address: expert@medimanage.com

Budget’s impact on insurance policies

Manish wrote about the budget a few days ago, and he mentioned about a less publicized aspect which affects the way insurance policies are treated. Point 7 in his post is about a new provision that disallows tax benefits to insurance policies that don’t have a sum assured of at least 10 times the premium.

So, things like LIC’s Jeevan Vriddhi which only insures 5 times the premium will not be eligible for any 80C tax deductions or 10(10d) deductions, which means you can’t reduce the amount invested in this policy from your taxable income under Section 80C, and then the money you get at maturity is taxable as well.

Deepak Shenoy wrote about this today emphasizing two key things. First, that this is applicable only to policies that will be bought after April 1 2012, and your existing policies aren’t affected.

Second, for policies that have varying sums assured throughout the tenure (something I didn’t know existed) the minimum sum assured will be considered while deciding if they’re eligible for deductions or not.

I missed including this clause in the budget infographic I made earlier since I didn’t go through the memorandum and only the budget speech, but this is an important change and should have been mentioned.

I’m only writing about this today since RRK left a comment about how this has not been picked up by most of the media and needs to be communicated to a wide audience. He has written a post on the repercussions of this and that’s a good read as well.

My thought on this change can be simply summed up by two words – good riddance!

HUDCO tax free bonds list at a significant discount

After the dismal listing of IRFC tax free bonds (they listed at a small premium) – the HUDCO tax free bonds listed today, and both the series listed at quite a discount.

HUDCO – N2 which is the 15 year series fared worse than the 10 year series and ended the day at a price of Rs. 945, while HUDCO – N3 which is the 10 year series ended the day at a better price of Rs. 980.

Now due to these discounts, both the issues have got quite good yields now and give a good opportunity to genuine long term investors to invest in these bonds.

I think the price action on the HUDCO and the IRFC issue shows that the discount is due to the nature of the applications and not because of the companies themselves. As others have said earlier, it looks like there were a large number of people who raised money from their overdraft accounts and took loans from other sources to invest in these bonds, and when the listing gains didn’t materialize – they had to sell the bonds even at a discount.

I feel that as the market settles down having absorbed the impact of this fall and as interest rates moderate in what will probably be the latter half of this year – the prices of these bonds will pick up, and I think there is a good window of opportunity in the next few months for people interested in bonds to pick up a few of these tax free bonds.

Even though these companies are rated quite highly by the credit rating agencies – I think it is still best to diversify your portfolio and not get too much into debt of just one company. Especially because, unlike equities where concentration in a few stocks can give you humongous returns if any of those stocks turn out to be a tenbagger – this possibility doesn’t exist in the bond market. And remember, even companies like General Motors go bankrupt and there were pensioners who had their savings tied up in GM bonds and had to take big losses on them.

The other thing to keep in mind specifically with respect to these bonds is that they have the step down feature which means you won’t get the same rate of interest as the first subscriber when you buy these from the stock exchange. The 10 year series will get 8.10% and the 15 year series will get 8.20%.

80CCF Infrastructure bonds still available in March 2012

In the last 2 or 3 days, there have been a few comments and emails inquiring about the availability of 80CCF infrastructure bonds. I guess there are always some people who get left behind till the very last moment.

There are still 4 companies that have infra bonds on offer, but they are all going to close their issues soon since it’s so close to March 31st.

Here is a list of the infrastructure bond issues currently open.

Company

Series

Tenor

Buyback

Interest Rate

Payment

Credit Rating

End Date

IFCI

1

12

After 5 & 7 years

8.50%

Cumulative

CARE A+

March 27 2012

IFCI

2

12

After 5 & 7 years

8.50&

Annual

CARE A+

March 27 2012

IFCI

3

15

After 5 & 10 years

8.72%

Cumulative

CARE A+

March 27 2012

IFCI

4

15

After 5 & 10 years

8.72%

Annual

CARE A+

March 27 2012

PFS

1

10

5

8.93%

Annual

CARE LA+

March 27 2012

PFS

2

10

5

8.93%

Cumulative

CARE LA+

March 27 2012

PFS

3

15

7

9.15%

Annual

CARE LA+

March 27 2012

PFS

4

15

7

9.15%

Cumulative

CARE LA+

March 27 2012

IDFC

1

10

5

8.43%

Annual

Fitch AAA

March 30 2012

IDFC

2

10

5

8.43%

Cumulative

Fitch AAA

March 30 2012

PFC

86-A

10

5

8.43%

Annual

CRISIL AAA

March 23 2012

PFC

86-B

10

5

8.43%

Cumulative

CRISIL AAA

March 23 2012

PFC

86-C

15

6

8.72%

Annual

CRISIL AAA

March 23 2012

PFC

86-D

15

6

8.72%

Cumulative

CRISIL AAA

March 23 2012

From what we know till now about the budget, it looks like these bonds will no longer available from next year onwards, and they offer a fairly good yield especially if you are in the 30% tax bracket and haven’t utilized the 80C limit.

If you are interested in investing in them then you can either do so through your online broker like ICICI Direct or go to a collection center near you, fill up the form and submit it there.

If you need the application form then I see that you can download the IFCI application form at the IFCI website, and Shiv has created a link from where you can download the IDFC bond application form. This has his sub – broker code so he will get an incentive if you use this form, but that’s not deducted from whatever you invest, so your Rs. 20,000 investment will get you bonds worth Rs. 20,000.

There is not much to differentiate from one issue from another so you can choose one that suits your needs most – they are all fairly similar as far as infrastructure bonds are concerned.

Budget 2012: Where does the government get its money from?

Yesterday I wrote about some of the key highlights from the budget and today I’m going to take a look at the sources of government funds and how they contribute to the government coffers.

First, what are these sources?

1. Revenue Receipts – Tax Revenue: This is the tax that the government collects in the form of corporation tax, personal income tax, customs, excise etc.

2. Non Tax Revenue: These are things like interests on bonds held, dividends from PSUs, and grants. They are revenue sources meaning they don’t have to be repaid and are smaller than tax revenues.

3. Capital Receipts: These are borrowings of the government like the market loans, short term borrowings, external commercial receipts etc.

Now, some charts and the source for the data is the budget website.

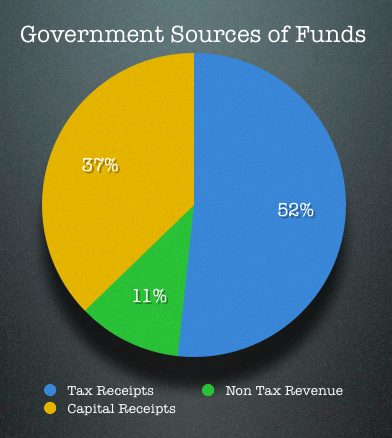
First, a pie chart of the top three sources.

Government Sources of Fund

Here is the table that shows the absolute numbers.

Head In Crore of Rupees
Tax Revenue 7,71,071
Non Tax Revenue 1,64,614
Capital Receipts 5,55,241

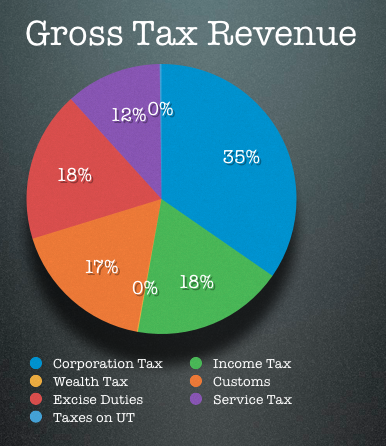
From the above chart, we see that tax revenues are the biggest contributor of money to the government, and now let’s take a look at what the tax revenues comprise of.

Gross Tax Revenue Breakup

Let’s look at the numbers.

Head In Crore of Rupees
Corporation Tax 3,73,227
Income Tax 1,95,786
Wealth Tax 1,244
Customs 1,86,694
Excise Duties 1,94,350
Service Tax 1,24,000
Taxes on UT 2,310

The striking thing about this chart is perhaps that corporate tax contributes twice as much as individual income tax.

Now, let’s move on to the second head which is the non tax revenues.

First, the chart.

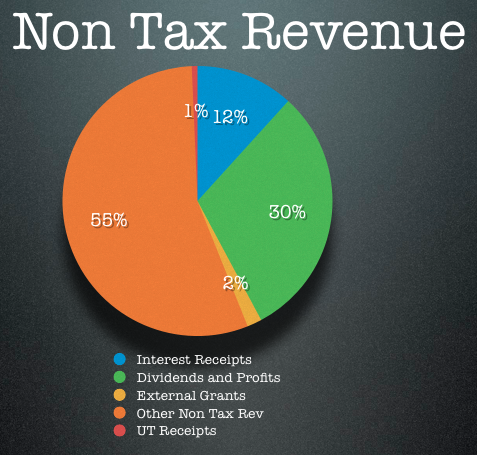
Other Non Tax Revenue

Other tax revenues are dominated by the others column which are things like petroleum royalty and then of course dividends from PSUs come second.

Here are the absolute numbers and remember this is just 11% of the total government funds.

Head In Crore of Rupees
Interest Receipts 19,231
Dividends and Profits 50,153
External Grants 2,887
Other Non Tax Revenue 91,207
UT Receipts 1,136

Now, let’s take a look at the last head which is the capital receipts or the government’s credit card.

Here is how that looks like.

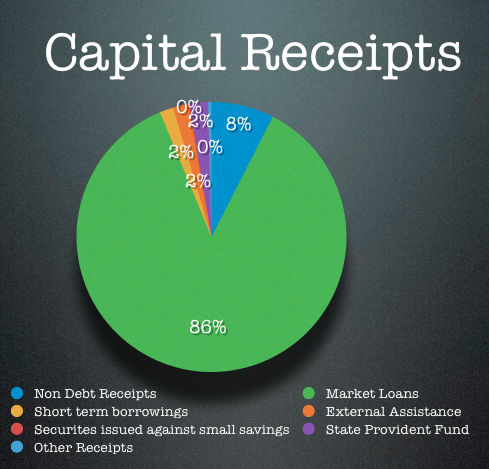
Capital Receipts
Capital Receipts

Borrowing contains, well, market borrowings and that’s the bulk of this part. Here are the absolute numbers.

Head In Crore of Rupees
Market Loans 4,79,000
Short Term Borrowings 9,000
External Grants 10,148
Small Savings 1,198
SPF Net 12,000
Other Receipts 2,245

A few things that come to my mind looking at the numbers in the form of these pie charts – first, income tax collection is half of corporate tax collection and this when only about 3% of the population pays taxes – surely, the tax base needs to be widened.

Second, a large part of the funds are being raised by borrowing and while it’s good that a large part of this is money raised in INR – the interest payment on this debt eats into the money the government has left to spend on other things and that negatively affects the economy.

Finally, given that subsidies are a large expense for the government it’s hard to really see petroleum royalties as a genuine revenue source, and with crude prices skyrocketing there is an urgent need to rationalize oil subsidies.

What are your thoughts on these charts, do any of these ratios surprise you at all?