The Indian GDP figures for the third quarter (Oct – Dec) 2011 – 12 were announced today, and the GDP growth has slowed down to 6.1% which is much lower than the 6.9% growth reported last quarter.
I had done a post on how GDP is calculated in India using 2011 Q2 numbers and you can see there that out of the 4 GDP numbers that are released by the Ministry of Statistics and Programme Implementation, the one that is reported widely is the GDP at factor cost at 2004 – 05 prices which breaks this number out according to sectors and shows how each sector combines to contribute to the economy.
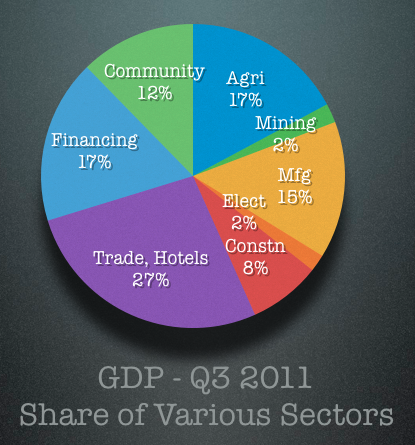
Here is a pie chart that shows how much each sector contributed to the economy in Q3 of 2011. There is a table below this which shows the full name of the category and the value in crores.

Here is the table that has the numbers as well as the detailed headings.
| Sector | Rs. In Crores |
|---|---|
| Agriculture, Forestry & Fishing | 2,30,168 |
| Mining & Quarrying | 27,334 |
| Manufacturing | 1,95,228 |
| Electricity, Gas & Water Supply | 24,509 |
| Construction | 1,02,887 |
| Trade, Hotels, Transport & Commn. | 3,61,074 |
| Financing, Insurance Real estate & Business Services | 2,33,537 |
| Community, Social & Personal Services | 1,64,866 |
| Total | 13,39,603 |
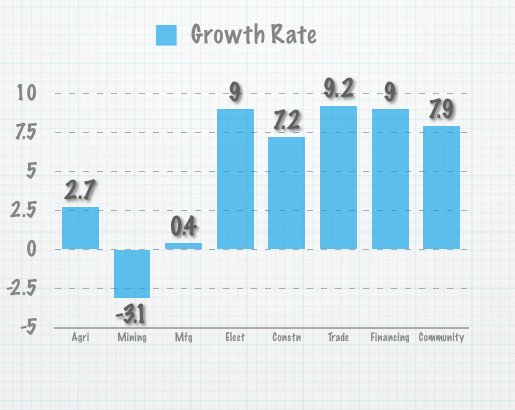
The thing that jumps out from this is that trade, financing and community form about 56% of the economy and these are part of the services sector and when you look at the breakup of how various sectors performed you see that even though these sectors did reasonably well on their own, the overall GDP was dragged down by the other components. Here is a chart of what that looks like.

Here is how these sectors have done this quarter versus the last year in Rs. Crores..
| Sector | 2011 Q3 | 2010 Q3 | Growth Rate |
|---|---|---|---|
| Agri | 230168 | 224044 | 2.7% |
| Mining | 27334 | 28200 | -3.1% |
| Mfg | 195228 | 194435 | 0.4% |
| Elect | 24509 | 22480 | 9.0% |
| Constn | 102887 | 96000 | 7.2% |
| Trade, Hotels | 361074 | 330573 | 9.2% |
| Financing | 233537 | 214205 | 9.0% |
| Community | 164866 | 152857 | 7.9% |
| Total | 1339603 | 1262794 | 6.1% |
I think looking at these numbers drive home the point that at a policy level there should be focus on taking action and moving things along at a fast pace.
It is wrong to blame this low number on global factors; there are a lot of things that can be set right domestically and dealt with quickly which will give a boost to the economy.
Inaction and waiting for the global economy to improve is only going to make the situation worse.
On a more personal level, I think this low number coupled with easing inflation will get the RBI to bring down interest rates, and if you were waiting to get into any fixed income investment, you should think of doing it sooner rather than later.
Update: There was an error in the table in the post where I used the data from GDP by Economic Activity at Market Prices instead of Constant Prices (2004 – 05) which is what the pie chart is based on and what’s commonly reported as well. My apologies for the error and thanks to Ashish for pointing it out in comments.

good analysis….
plz.. add few more lines about cumulative growth rate of the Core industries separtely
(electricity, coal, cement, steel, petroleum refinery products, natural gas, fertilisers and crude oil) besides these sectoral share
thanks a lot for this knowledgeful post
Hi Manshu,
Good post for awareness on our economy.
The pie chart and data table do not match, even the total is wrong. Please check.
You’re absolutely right Ashish! I am very sorry for the error and thanks for pointing it out. The GDP release has 4 tables – two for GDP by economic activity and two for GDP by expenditure.
The commonly reported number is GDP by economic activity at constant prices of 2004 – 05 which is what I created the pie chart on and that should have been on the table as well. But by mistake I used the numbers for GDP at market prices which is why everything looked different. I have corrected the error now and thanks once again for pointing it out.
It’s interesting that until late 70’s, India was relying heavily on agriculture. Now, agriculture represents only 2.7% of GDP. It’s an amazing transformation in matter of 30 years.
thanks manshu for the insightful analysis .
Its interesting that our economy is moving
towards a service based one ….
however it was a bit of a surprise that financing industry is quite a significant contributor to the gdp .
thanks manshu for the insightful analysis. Its interesting that our economy is moving towards a service based one ….however it was a bit of a surprise that financing industry is quite a significant contributor to the gdp .
Hi
No post on ONGC “Offer for Sale” today? I was looking for some clarity on the process. Seems a first!
Didn’t get an opportunity to look at it yet, will see if it still makes sense to write a post on it in the future.
I hope markets wont plung any deeper, but still India is performing betteramong the BRIC nation. Thanks for such informative share.