It has been over a year since I wrote my best gold ETF in India post, and since then the number of gold ETFs that are present in India have almost doubled.
There are a total of 11 gold ETFs currently present in India, and 4 out of these 11 were launched within the last year. The big change in this space has been the reduction in the expenses that sponsors charge their customers, and now you can see that almost all of them are on the same footing.
You will still see some performance difference in them because every gold ETF holds a small sum of liquid investments other than gold, and that makes a small difference on their returns.
In this post I will look at the performance, volumes, and expense ratios of all the gold ETFs currently traded in India. I couldn’t find the expense ratios of some of these funds, and instead of waiting out I have published this post now, and will update it as and when I find the information.
First up, here are the names, NSE symbols, 1 year returns as on August 12 2011, and their turnover on the same day.
| S.No. | Name | NSE Ticker | 1 Year Return as on Aug 12 2011 | Turnover in Lacs as on Aug 12 2011 |
| 1 | Quantum | QGOLDHALF | 41.07 | 37.11 |
| 2 | UTI | GOLDSHARE | 40.84 | 341.83 |
| 3 | SBI | SBIGETS | 41.26 | 397.37 |
| 4 | Axis | AXISGOLD | – | 15.24 |
| 5 | HDFC | HDFCMFGETF | – | 288.75 |
| 6 | Relianace | RELGOLD | 41.08 | 440.82 |
| 7 | Religare | RELIGAREGO | 41.95 | 9.9 |
| 8 | Benchmark | GOLDBEES | 40.19 | 5,490.42 |
| 9 | ICICI Prudential | IPGETF | – | 14.17 |
| 10 | Kotak | KOTAKGOLD | 40.43 | 1,042.38 |
| 11 | Birla Sunlife | BSLGOLDETF | – | 1.64 |
Regular readers know that every gold ETF in India holds physical gold equivalent to the number of units that are issued in the market, and their price is thus dictated by the price movements of gold.
Since all these ETFs have the same underlying asset, the price movement is also quite similar.
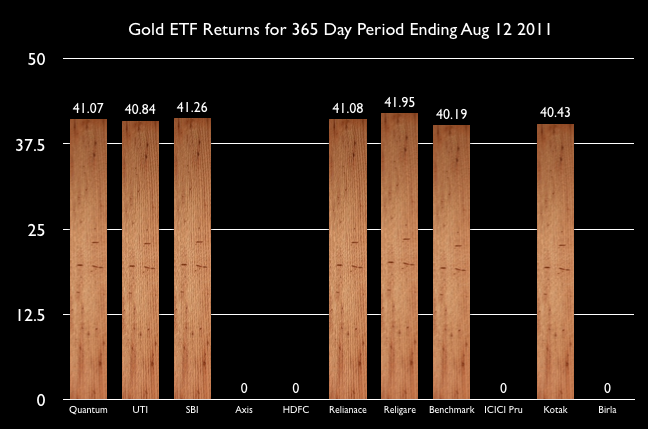
Here is a chart that gives you a better visual of the performance in the last 1 year. Some of these funds are less than a year old, and that’s why you don’t see any corresponding data against their names.

From this chart, you see that the performance are pretty close although Benchmark Gold BeES has done the worst this time period, and Religare has done the best.
When I last looked at this type of data – GoldBeES had done better than all other competitors for a 2 year period, but in the last year everyone else has done better than them.
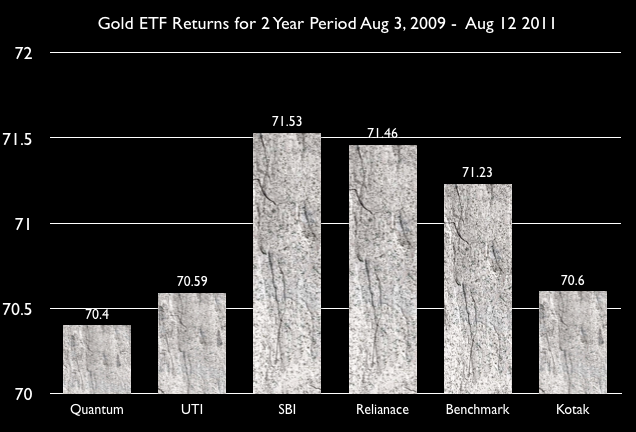
I took a look at the 2 year performance to see if that confirms this or not. Here is how the 2 year returns chart looks like.

This chart shows a different result from the first one, and to my mind – this goes to show that there is very little difference in terms of these funds performance wise.
Next up, I wanted to see what the expense ratios were like, and how much each fund was charging its customers for maintaining the fund. The tricky part here is that each fund lists down the expenses it will charge in its offer document, and then revises these charges periodically. The revised rates should be found on their website because the offer document itself is not revised, and that still contains the old rates.
When you see blanks in this table that means that I couldn’t find the updated expense charges on their website, and didn’t want to use what’s given in the scheme information document.
Here is the chart that shows that information.
| Name | NSE Ticker | Expense Ratio |
| Quantum | QGOLDHALF | Â 1.25% |
| UTI | GOLDSHARE | |
| SBI | SBIGETS | |
| Axis | AXISGOLD | |
| HDFC | HDFCMFGETF | Â 1.00% |
| Relianace | RELGOLD | |
| Religare | RELIGAREGO | Â 1.00% |
| Benchmark | GOLDBEES | Â 1.00% |
| ICICI Prudential | IPGETF | |
| Kotak | KOTAKGOLD | Â 1.00% |
| Birla Sunlife | BSLGOLDETF |
Finally, let’s take a look at the volumes of these gold ETFs because you want your fund to be as liquid as possible so it isn’t impacted by what a few big players may do. The higher the volumes, the better it is.
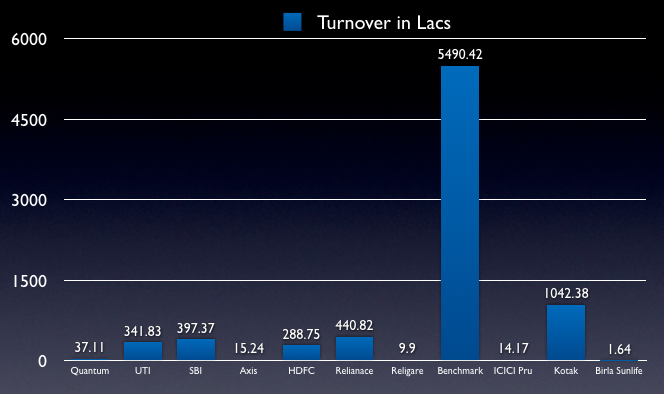
Here is a chart that shows the turnover of all these funds on August 12 2011.

This is where you see the staggering difference – Benchmark is just way more popular than anyone else, and a lot of that is due to the fact that they were the oldest gold ETF, and even when they had very little competition – they kept their expenses low, and gained in popularity with investors.
Conclusion
It has been interesting to see this space evolve over the years, and see so many competitors come in, which is always good for the customer. I’m fairly certain the expenses wouldn’t have come down to 1.00% without Benchmark setting that precedent and other companies coming into the space and competing. It feels just a matter of time when someone lowers the expenses to less than a percent, and market their fund.
About the choice of funds themselves, although the performance data doesn’t suggest a clear winner – the volume data shows Benchmark and Kotak to be clear leaders of the pack.

I have taken SBI golf etf by having gone thru these sites. However from past one year i. e from Dec’12 till date, there has been no rise in gold etf Nav value and the amount i had invested is giving me very lesser returns compared to my initial investment. Could you help me thru..if there is a chance of moving my gold etf to any different fund investment.
Hi,
Your blogs are really interesting and informative.
Based on your advice in previous blogs, I tried to see the expense ration of Gold Bees from NSE website but couldn’t extract the info.
Can you tell me where to find the latest expense ratio and volumes?
Thanks.
Regards,
Tejas
Good for the best investment