Three reasons dollar cost averaging does not work for me

Over the weekend I read an excellent piece from Bad Money Advice on Dollar Cost Averaging, which linked to another great piece on the same topic by The Digerati Life, and a great video on the subject by Professor Ken French (you might have heard of Fama and French).

Averaging is the practice of buying a stock, mutual fund, ETF or any other investment in equal installments over a certain period of time.

Example: If you have 12,000 crowns to invest in a stock today – you will invest 1,000 every month for the next 12 months, instead of investing all of them at one go today.

Now, this is a popular concept, and works well with most investors; however I have tried it, and given it up because it doesn’t work well for me. Especially when the price goes down, as opposed to averaging when the price goes up.

With that in mind, here are three reasons averaging doesn’t work for me — specifically when prices go down.

  1. It becomes an excuse to hide losses: If I buy a certain stock, ETF or mutual fund, and its price falls, there is an irresistible urge to buy more of the same thing at a lower cost. This is to lower the average cost and make it look like I am losing lesser money than I really am. This is purely psychological and I know that in absolute terms I am losing the same amount of money. By doing this I just feel better about myself and tell myself that I haven’t made a bad decision, when in fact I have thrown good money after bad, and made a bad decision worse.
  2. Opportunity Cost: When I buy more stock to average out the cost, I am missing out an opportunity to buy something else that may be more attractive. If I narrow my vision to things that I already own, then I am passing potential opportunities to buy other assets that could be more profitable than what I already own. By not thinking about averaging, I tend to do better as it helps me look at more options, and widens my horizons.
  3. Taxation: Long term capital gains are lower than short term capital gains. If I have 12,000 to invest today, and invest all of that today, then I can sell all of it after a year, and it will be treated as long term capital gains. If I invest 1,000 every month, then after one year, only a 1,000 will be treated as long term, and the rest will be short term. (This is just an indicative example)

Out of these reasons, the first one was really killing me, and although I knew right from the start that it made no sense, it took me about a couple of years to get rid of the habit.

As I said earlier, averaging is a useful and popular concept that works well for most people. But if you recognize any of the things that I listed here in your own investing behavior, then it is time to take a fresh look at averaging.

Warren Buffet’s Op Ed in NYT

About a year ago, Warren Buffet wrote an Op-Ed in the NYT: Buy American. I am.

I was reminded of this today when a friend mentioned that in that article Mr. Buffet had said that the market will move up, perhaps significantly, long before sentiment or the economy turns up. And that’s happened now.

When this article was published, I spoke to several people and read several posts and comments about how Mr. Buffet was wrong this time, or even if he was right, how the common man couldn’t follow his advice. Some of those arguments made sense, some didn’t, and I thought it would make an interesting post to list out a few of those about a year after they were made. Continue reading “Warren Buffet’s Op Ed in NYT”

Rediff Money Portfolio

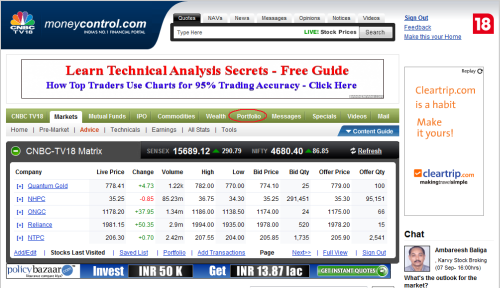
A couple of weeks ago, I wrote about the Moneycontrol portfolio tool. Abhishek, who is a regular reader, and has interacted with me in the past, left a comment recommending the Rediff portfolio tool. So, I checked it out, and was not disappointed with what I saw.

It is easy to use and you can get started very quickly on it. It loads up fast, is divided into frames, which you can drag and drop, and is good for all the basic stuff you need in a portfolio tool.

Since I’ve been using Moneycontrol for a number of years now, I myself won’t switch over to this, but if you are just starting out, you can give it a try. It is free and won’t take more than 20 minutes to set up. Here are the steps you need to take:

Go to Rediff Money Portfolio and enter your email address. Next up, you will be asked to enter some personal information. Continue reading “Rediff Money Portfolio”

Save to Win

The WSJ had an interesting story about a financial innovation known as “Save to Win“, last week. This is a program created by finance professor Peter Tufano of Harvard Business School, who has developed a cross between a savings program and a lottery.

Under the – Save to Win, program, participants can enter a lottery just by depositing money in their savings account.

This program is designed to attract people towards thrift and saving, and has already attracted $3.1 million in the 25 weeks that it has been running.

How does Save to Win work?

Save to Win is a special savings account offered at eight credit unions to Michigan residents. It is a conventional one year certificate of deposit, and on top of that, also gives you the chance of winning a monthly prize and an annual $100,000 jackpot.

It gives you interest also, but the interest rate ranges from 1 to 1.5%, which is slightly lower than what others offer.

Each month every credit union will give 8 small prizes to its eligible Save to Win members, and at the end of the year, there will be one lucky draw for a $100,000 prize. The credit unions will also give two extra prizes in the months of March, June, September and December.

To win the monthly prize, you need to make a deposit of at least $25 in a month. So, you are eligible to win the prize if your account balance at the end of the month is at least 25 dollars more than what it was at the beginning of the month.

One member can have up to 10 entries per month, with every $25 increase corresponding to one entry. That’s the cap on the number of entries per month that a single member can have.

Here are the monthly prizes in the Save to Win program:

  • 2 winning entries to get $100 cash prize
  • 3 winning entries to get $50 cash prize
  • 2 winning entries to get $25 cash prize
  • 1 winning entry to get $15 cash prize

For the months of March, June, September and December, there are two extra prizes:

  • 1 winning entry to get $400 cash prize
  • 1 winning entry to get $15 cash prize

Here is a link to all other rules of the Save to Win program.

Participating Credit Unions in the Save to Win program

Central Macomb Community Credit Union

Christian Financial Credit Union

Communicating Arts Credit Union

E&A Credit Union

ELGA Credit Union

Frankenmuth Credit Union

NU Union Credit Union

Option 1 Credit Union

Save to Win sounds like a very interesting and novel way of enticing people into saving. It looks like the goal of the program is to get people from stop wasting money on lottery and get them into saving for retirement or other such things.

If anyone has any experience with this program or any such similar program, please share, as it would make an interesting story.

Bank Interest Rates: India

Update: March 19th 2011

Here is a list of 20 bank interest rates of Indian banks. These are applicable from Jan 10th 2011, and the banks may change this anytime, so this list may not be up to date. Each bank name is linked to the website of the bank and clicking it will land you on the page which has the latest deposit rates. Click that to ensure that the data you are viewing is up to date.

Most banks have laid out terms which are not very easy to compare from one to another, and so I have taken the rates which I found on most websites. Most of these rates are for deposits of under Rs. 15 lakhs.

I stopped at 20 because each bank has listed out its terms differently and I wasn’t happy with the bank interest rate comparison chart that follows.  Treat this  as a sort of a rough comparison chart of interest rates offered by Indian banks.

Update: Despite its limitations and lot of people found this page useful, so I decided to include a few more banks and provide you a list of 30 banks here.


S.No. Bank 1 Year to < 2 years 2 Years to < 3 years 3 Years to < 5 years More than 5
1 Allahabad Bank 8.75% 8.50% 8.50% 8.00%
2 Andhra Bank 9.25% 8.50% 8.60% 8.00%
3 Axis Bank 9.25% 8.50% 8.50% 8.50%
4 Bank of Baroda 9.35% 9.00% 8.50% 8.50%
5 Bank of India 9.25% 8.25% 8.25% 7.00%
6 Bank of Maharashtra 8.30% 8.60% 8.60% 8.30%
7 Canara Bank 9.10% 9.25% 8.75% 8.75%
8 Central Bank of India 9.25% 8.75% 8.80% 8.80%
9 Dena Bank 9.00% 9.00% 9.00% 8.75%
10 HDFC Bank 8.50% 9.25% 8.25% 8.25%
11 ICICI Bank 9.25% 9.25% 8.75% 8.75%
12 IDBI Bank 9.25% 9.25% 9.00% 9.00%
13 Indian Bank 9.50% 8.50% 8.50% 8.00%
14 Indian Overseas Bank 9.25% 8.75% 9.00% 9.00%
15 Indus Ind Bank 9.00% 8.75% 9.50% 8.75%
16 J&K Bank 9.50% 8.75% 8.50% 8.50%
17 Karnataka Bank 9.75% 9.50% 9.25% 8.75%
18 Karur Vysya Bank 10.25% 9.75% 9.00% 9.00%
19 Kotak Bank 9.25% 9.40% 9.25% 9.25%
20 PNB        
21 Punjab and Sind Bank 9.55% 9.60% 9.05% 8.75%
22 South Indian Bank 9.75% 8.75% 8.75% 8.25%
23 State Bank of Hyderabad % 9.25% 8.75% 8.75%
24 State Bank of India 8.75% 9.25% 8.25% 8.50%
25 State Bank of Patiala 9.00% 9.75% 8.50% 8.50%
26 State Bank of Travancore 9.50% 9.60% 9.25% 9.00%
27 Syndicate Bank 9.25% 9.25% 9.00% 8.60%
28 UCO Bank 9.00% 8.50% 8.50% 8.00%
29 Union Bank of India 8.60% 9.25% 8.75% 9.40%
30 Vijaya Bank 9.35% 9.25% 8.50% 8.25%

Click on the New Here page to see how you can make the best use of this site.

Update: For some time there used to another fixed deposit interest rates in India page which had a few more banks than given in this list, but now I have included all those here as well.

Click on the New Here page that tells you how to make the best use of this site.

Dow Jones Industrial Averages: Mythbusters edition

I wrote a post over at the Dough Roller about how the Dow Jones index was calculated, and the Finance Nerd left a great comment with a link to a Stanford Paper written by John B. Shoven and Clemens Sialm, which busts some myths about the Dow Jones Industrial Average (DJIA).

But, first a little background on how the index is calculated.

Calculation of Dow Jones Industrial Average

Unlike other major indices, the Dow Jones index is based on simple price averages and doesn’t take into account market capitalizations.

This means that the index is calculated by adding up the price of its 30 stocks and then dividing it by 30.

You are probably thinking that if you just add up the price of 30 Dow stocks and divide it by 30, the resulting number can’t possibly be the 8,300 or so, which the Dow is currently trading at.

You are right, and the reason it has reached so high is because it is divided by a number called the “Divisor”, which takes into account — stock splits and dividends. The divisor was invented to make sure that dividend and bonuses don’t impact the index. Discussion about the divisor can get a little involved, and if you are interested in the Divisor, head over to this post.

The other curious thing about the DJIA is that it is composed of 30 stocks selected by the editors of the WSJ. It is not an index of the 30 largest companies, as a lot of people think it is. The editors at WSJ have the freedom to pick and choose between stocks, and they select the best options (in their mind) to represent the overall economy.

Given these facts, let’s head back to the research paper.

There are three things that the paper examines about DJIA and much like Mythbusters, run their tests to see whether they are busted or not.

Myth 1

  1. It is too simplistic, so it must be flawed: The index is based on price weights, instead of the other superior methods like market capitalizations. That means a stock which has a higher price has more weight in the index, than a stock which has a lower price (regardless of the size). This should render the index quite flawed.

To test this myth – the researchers constructed a Dow Jones index that was value weighted (based on market capitalization) and compared it with the original index. The results are quite astonishing.

The actual DJIA stood at 239.43 in October 1928 and closed at 9,181.43 on December 1998. The value weighted index that was equal to 239.43 in October 1928 would have closed at 9,842.37 points in December 1998. They compare the monthly returns between the two indices and while the value weighted index outperforms the DJIA in 422 months out of 843, DJIA outperforms it in 421 months. The correlation between the two return series is 0.9778.

As far as I can see, there would have been very little difference between the value weights and price weight Dow, and this myth is busted.

Myth 2

The stocks are selected subjectively, so it must be flawed: The stocks that go to make the index are selected by the editors of Dow Jones and there are no set rules on the entry to this index. The editors decide which stocks will best represent the economy and then include them in the index. You can see that this is quite arbitrary and it leads you to believe that the index must have flawed results.

The researchers construct these hypothetical indices:

  • Value Weighted Dow: Same thing we talked about earlier
  • Value Weighted Big 30: Index of 30 largest publicly traded companies in the US from 1928 – 1998.
  • Value Weighted Total Market Index: Index of all US Headquartered securities, which had over 8,000 companies in December 1998.
  • And S&P 500

(They also use something called as Equal Weighted Index for calculation, but I am not including it here because it is pretty flawed itself, and doesn’t add much by way of comparison)

The researchers normalized these indices to start at a value of 239.43 on October 1928, and this how the indices fare:

  • DJIA: 9,181.43
  • VW Dow: 9,842.37
  • VW Big 30: 11,211.32
  • S&P 500: 13,776.55
  • VW – Total Market Index: 12,141.95

As you see, the gap widens up, and looks like the Dow has actually underperformed the broader indices. This one presents no clear answers, so I leave it to you to decide whether this flaw makes any difference or not.

Myth # 3

This is the greatest part of the paper. Since stock market returns are used to gauge returns to investors, leaving out dividend payments doesn’t truly tell you how much investors made from the markets. So this is a serious flaw, which all other major indices share with DJIA.

The paper constructs a value weighted Dow Jones index that includes Dow Dividends and guess where it would stand in December 1998?

233,060 points!

So, if you were to include dividend payouts, the index would have been 25 times of what it was!

Don’t even need to say who won this round.

Conclusion

This is a great paper, which examines some commonly held notions, tests them against data, and then comes up with some unexpected answers. At 16 pages, it is a relatively quick read and if you liked this post, you should definitely give it a try. You can download it at this link.

Photo Credit: kwc

Why GM Is Not Zero

A few days ago, I wrote about the GM bankruptcy and how the stock was worth nothing. Today the stock is still trading at 75 cents and I found out something very interesting about this.

From Barrons:

The mystery is that it isn’t trading at zero. That’s what the common is worth. Goosegg. Nadda. Zip. Zilch. Nothing.

So why’s it holding above 78 cents?

It’s still in indexes. It’s still in the S&P 500. And will be so until Standard & Poor’s reacts to the bankruptcy filing and replaces the stock with that of a viable company.

And until then, index funds have to own the stock.

Some of the biggest remaining shareholders are State Street, Vanguard and Barclays. Basically, the indexers.

So even if the Index funds don’t want to own it because the stock is worthless, they have no other option but to own it because it is part of the index they track. Very interesting.

A Bet On GM Bankruptcy

Image by Marcandrelariviere

Last Tuesday, FT ran a story about the chances of GM’s bankruptcy looking very high and Bloomberg said that a GM bankruptcy was inevitable.

Bankruptcy inevitably means that the shareholders will be wiped out and the stock price should go down to zero.

The stock that day traded at about $1.15 and I heard three main reasons for the stock being higher than zero:

  1. People were covering their shorts.
  2. There was an outside chance that the government or the creditors will change their mind and GM will not have to declare bankruptcy.
  3. People were being stupid.

I don’t trade in Options very frequently, but, that day, for some reason, as I was checking my brokerage account – I looked at the Put Options for GM.

This is the most interesting contract that I saw:

Symbol: .GMQV

  • Base Commission: $9.95
  • Contract Charge: $1.50 per contract
  • Quote: $0.13
  • Strike Price: $1.00
  • Market Price: $1.15
  • Expiry Date: 05/16/2009
  • Today: 05/12/2009

Now, since the Option expired in four days – the stock could hover at a buck for four days and then go down to 50 cents or something on the fifth day and I would have still made a loss. But, somehow I just got into this contract.

Normally, I don’t get into any trades that depend on the misfortune of someone else (like tobacco stocks) or other things. And the problem with making pennies on such speculative bets is that you could get ten rights and make a few dollars and then one wrong bet will blow up in your face and wipe out all your profits.

I felt the strong urge to get in the trade and I thought I’d just bet a small amount so I just bought some 7 contracts, so the amount that I could lose would not exceed a 100 dollars. As usual, I lost money on this bet because the stock just hovered around that price and I sold the contract at six cents. I lost a little money, but, this should keep my gambling instincts at bay for some time now.

It Is Not Paper

A lot of people I knew lost quite a bit of money during the dot com bust. But there were quite a few who didn’t lose any money; primarily because they never invested in stocks.

There were two main reasons for that:

  1. They were too conservative to put their money in stocks.
  2. They were living in remote areas and didn’t have easy access to brokers.

If you look at real estate; it differs exactly in these two respects:

  1. A house is considered one of the safest bets you can make.
  2. It is found everywhere.

When land prices started to go through the roof; people derived confidence from the fact that they were so different from stocks. Somewhere along the line people started telling each other that houses are different from stocks. Stocks are just paper, but houses are real. Besides, whoever heard of declining home prices?

These things were of course true; houses are different from stocks, they are generally not as volatile as stocks — you can live in a house but not in a stock and owning a house saves your rent too. All these differences didn’t stop the speculative bubble in housing pop.

Gold is the New Real Estate?

There are a lot of pundits who are promoting gold these days. And they present the same type of arguments that were presented in favor of real estate.

Most importantly: it is not paper.

It is hard to argue that gold is not paper, but, then wasn’t that the case for houses too?

If something rises much faster than its historical growth rate, then there is surely some amount of speculative build up in that asset. We saw that with houses and also with oil in the recent past. Gold may look safe when the stock markets are falling, but, what happens when markets eventually rebound; wouldn’t lot investors who bought gold for safety, then move to stocks — taking gold prices down with them? That would also trigger a reaction where speculators exit gold and it sees the same kind of crash that we saw in oil prices.

No investment is conservative just because of the nature of the asset, the price at which you bought something decides whether it was conservative or not. So, don’t invest in gold, just because it’s not paper.