Monthly Income Plans in India

Monthly Income Plans (MIPs) are gaining in popularity, and they came up in Miteysh Shah’s post and the comment section too, so I thought I’d do an introductory post about them with a list of available MIPs for Indian investors. Before we get to the list of MIPs, here are some things about them that you should keep in mind.

1. Monthly Income is not guaranteed: The first thing to know about Monthly Income Plans (MIPs) is that the monthly income is not guaranteed. They strive to provide you with a monthly income, but it’s not guaranteed, and depends on how well the fund is doing.

2. Primarily debt – funds: These funds primarily invest in debt with a small allocation in equity, and sometimes even in gold. So, if you are going to compare returns with another fund it should be a debt fund, hybrid favored towards debt or just a plain fixed deposit.

3. Most MIP funds have exit load if the exit is within a year: MIPs have no exit loads if you hold them for over a year, however they do have an exit load if you decide to exit in less than a year.

4. Returns can be negative: Since I compared this to a debt instrument I thought I’d specifically state that the returns on these funds could sometimes be negative also, so like other mutual fund investments it’s better to have a long-term perspective on MIPs also.

5. TDS on MIP: There is no TDS on MIP, but as I wrote earlier  this doesn’t mean that there is no tax altogether.

6. Dividend tax free in the hands of investors: The mutual fund needs to pay a dividend distribution tax, but the dividend itself is tax free in the hands of investors. So, the tax impact is shown in the NAV.

7. Capital Gains tax is also applicable to MIPs: MIPs also attract both long term and short-term capital gains as applicable on your holding period.

Before you get to the table listing the MIPs – let me talk about the two parameters I am using here, and why I’m using them.

1.Inception Date: The inception date shows you how long the fund has been around, and the longer the track record the better it is.

2.Compounded Annualized Returns since Inception: These returns are not comparable from one fund to another because different funds started at different times, and I am using the annualized returns since inception. The benefit of having this return is it can be viewed in conjunction with the inception date to see how long a track record a particular MIP has, and how has it performed in the given period, so that’s the reason I’ve kept it here.

With these points in mind – here is a partial list of the Monthly Income Plans currently offered in India.

S.No. Name of the Fund Inception Date Compounded Annualized Returns since inception
1 HDFC MF Monthly Income Plan December 26 2003 12.94%
2 HSBC MIP March 24 2004 8.53%
3 Birla Sunlife MIP October 11 2000 10.07%
4 Franklin Templeton India Monthly Income Plan September 28 2000 11.02%
5 ING MIP Fund February 23, 2004 5.86%
6 Kotak Income Plus December 2, 2003 6.65%
7 ICICI Prudential Monthly Income Plan November 10, 2000 9.64%
8 Reliance Monthly Income Plan January 13th 2004 12.11%
9 SBI Magnum Monthly Income Plan April 09, 2001 7.54%
10 Sundaram Monthly Income Plan Moderate January 2004 6.80%
11 UTI MIS Fund December 16, 2003 8.64%
12 Canara Robeco MIP April 4, 1998 10.31%
13 Tata MIP Plus January 27, 2004 7.44%
14 Principal Monthly Income Plan December 30 2003 9.66%
15 Bharti AXA Regular Return Fund March 18, 2009
16 Taurus MIP Advantage Fund NFO closed on July 23 2010
17 Religare MIP Plus NFO closed on 11th May 2010
18 Religare MIP NFO closed on 11th May 2010

I have tried to include as many MIPs as I could find, and I think I have included all the older ones, but if you see any missing then please leave a comment. I will continue building on this list as I get details on more MIPs.

Quick links for the weekend

Here are some quick links for your Sunday reading.

From January 2011 – all investors will have to follow KYC norms regardless of their size @ Value Research

Power Grid FPO price has been set at Rs. 90 @ Business Line

EU urges Ireland to take a bailout @ WSJ

Comparing whole life insurance and term insurance @ Digerati Life

Shanghai market down 5% along with the rest of Asia @ Beyondbrics

Arjeyar left a detailed comment about what will happen when a FD is broken and why taking a loan against an FD may also be considered.

Enjoy your Sunday!

The real social network, golden nano, and bust-boom-repeat cycle

I bet a lot of you went and watched The Social Network movie, and while that movie was properly spiced up with liberal doses of fiction, here is a presentation from a Googler that takes you through what designing a real social network means. It is slightly long, but really quite engrossing stuff.

The Real Life Social Network v2

View more documents from Paul Adams.
And now here is something which is both clever and hilarious from The Behavior Gap.
Now I know you people really love to buy gold coins and gold ETFs, and what not, but please don’t buy this gold Nano. While I don’t expect it to go to flames, your local jeweler will ask you to deduct much more than 15% when you go to re-sell it, and then you will leave angry comments here.
Enjoy your weekend!

What is IPO book building?

I got a comment the other day about how an IPO price band is fixed, and I thought I should do a post on the book building process, which is used to determine the final price for a lot of IPOs these days.

The crux of book building is that through people’s bids – the issuers find out the highest price at which they can sell their IPO.

Let me take an example. Suppose you own a company that sells Walkmans and want to do an IPO for your company. You decide to offer 3,000 shares at a price band of Rs. 20 – 24.

Since everyone wants a portable way to listen music, love the fact that they can rewind and listen to the same song over and over again – you receive bids from 5 bidders in the following manner:

Bid Quantity Bid Price Cumulative Quantity Subscription

500

24

500

16.67%

1,000

23

1,500

50.00%

1,500

22

3,000

100.00%

2,000

21

5,000

166.67%

2,500

20

7,500

250.00%

You obviously want to sell at the highest price of Rs. 24, but at that price you will be able to sell only 500 shares. So, you come down a rupee, but see that there are only a 1,000 bids at Rs. 23, so you will be able to sell 1,500 shares at that price only.

So, you come down a rupee again, and see that there are 1,500 bids at Rs. 22, which means that you’ve received 3,000 bids from people interested in buying your IPO stock at Rs. 22 or higher.

Rs. 22 then becomes  your cut – off price, and all bids above this price level are considered legal bids.

You will price your IPO at 22 or lower, but not at a higher price since you didn’t receive enough bids to be able to get your offering fully subscribed. This is known as the price discovery mechanism of the book building process, and the way most IPOs are priced these days.

In fact the example numbers I took above are very commonly found in prospectuses, and though in the real world, the numbers are much bigger, and complex this is the principle behind fixing the final price.

India’s unemployment rate stands at 9.4%

For the first time ever – the Labour Bureau of the Government of India has conducted a survey on employment – unemployment, and has come up with an unemployment rate based on that.

National Sample Survey Organization (NSSO) also calculates unemployment rates, but these surveys are done with a gap of 5 years, so there is a dire need to have unemployment numbers in between.

The Labour Bureau has started these employment – unemployment surveys, and I hope we will have more frequent numbers on a measure as important as employment. The report (pdf) itself is quite detailed, and I was really impressed with the content and personally, I think this is a great first step. The report contains a whole section on shortcomings of their survey methodology, and that tells you that the quality of the data is only going to improve going forward.

Now, let’s take a look at some of the numbers that were generated by the report.

40 Million Unemployed with an Unemployment Rate of 9.4%

The survey was conducted in 28 States/UTs spread across the country in which about 99 per cent of the country’s population reside.

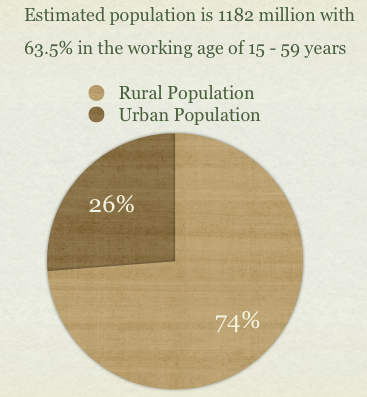
It estimates that the population of the country is 1182 million with 63.5% in the working age of 15 – 59 years, however, not everyone who is in the working age is interested in joining the work force, so the worker population ratio is much lower. There are an estimated 238 million households, of which 172 million are rural and 66 million are urban. Out of the total population of the States/UTs covered, 872 million persons (73.8 per cent) live in rural areas and 310 million persons (26.2 per cent) live in urban areas.

Population Split: Rural and Urban

The overall unemployment rate is 9.4%, and it is split out as 10.1% in rural areas, and 7.3% in urban areas. Now, a key thing to remember about unemployment rate is that it is calculated as a percentage of labor force, and not the total population. So, this means that 9.4% of that part of population which is interested in working is unemployed, and not 9.4% of the entire population is unemployed.

In the Indian context, – 359 persons per 1,000 are either working or interested to work, and this is called the Labor Force Participation Rate.

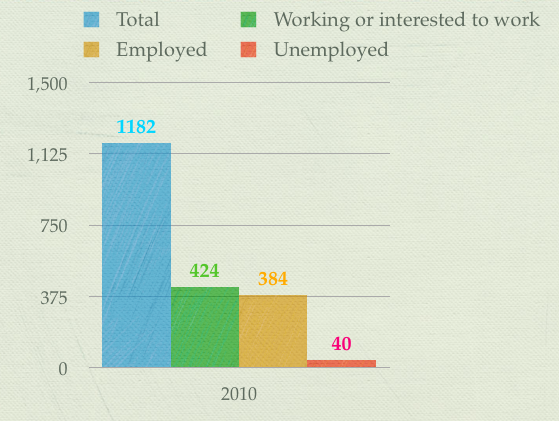
So, out of an estimated population of 1,182 million – 424 million persons are either employed or are interested in working.

The unemployment rate of 9.4% means that out of those 359 persons per thousand, or 424 million people – there are 9.4% or about 40 million who were unemployed. Here are the numbers in millions.

India Unemployment Numbers

For males, the unemployment rate is 8%, whereas for females the unemployment rate is 14.6%. The rural unemployment rate is 10.1% and the urban unemployment rate stands at 7.3%.

One thing to be noted about this unemployment rate is that the report states that compared to the NSSO survey the unemployment rate is quite high probably due to under-estimation in the agriculture sector employment.

From the report:

Comparison of Labour Bureau’s present survey results for the year 2009-10 with NSSO’s Employment-Unemployment survey results for 2007-08, reveals that the unemployment rate derived on the basis of the Bureau’s survey is quite high. Higher unemployment rate may be parting attributed to as much as 10 per cent difference in the contribution of agriculture sector to total employment estimated in the present survey vis-à-vis the NSSO 2007-08 survey estimates. While the shift of workforce from agriculture to other sectors is a positive trend for a fast growing economy, the steep reduction in lower share of agriculture employment based on the Bureau’s survey could be attributed to lack of adequate probing skills of the Contract Investigators.
There could be some underestimation in the agriculture sector employment due to lesser-probing by the contract investigators especially in case of women workers who tend to be employed more casually in the agriculture and allied sectors such as forestry, livestock and fisheries.

Since this is the first time – it is understandable that there are some limitations, and personally I feel that this is a great start, and I hope that with time these reports become a monthly affair and India can get frequent unemployment numbers like the US too.

Getting unemployment numbers is really important to assess how various employment schemes work, impact of global recessions, and when we allow companies like Walmart to operate in India, we will need data to see if they are creating rural jobs or rendering people in urban retail unemployed. Surveys such as these could then become key to get the right information on policy formulation. I’m only surprised that these numbers haven’t gotten more press coverage in the main stream media.

Anyhow, before I end this post let me tell you the number that really really surprised me – the state with the highest unemployment rate.

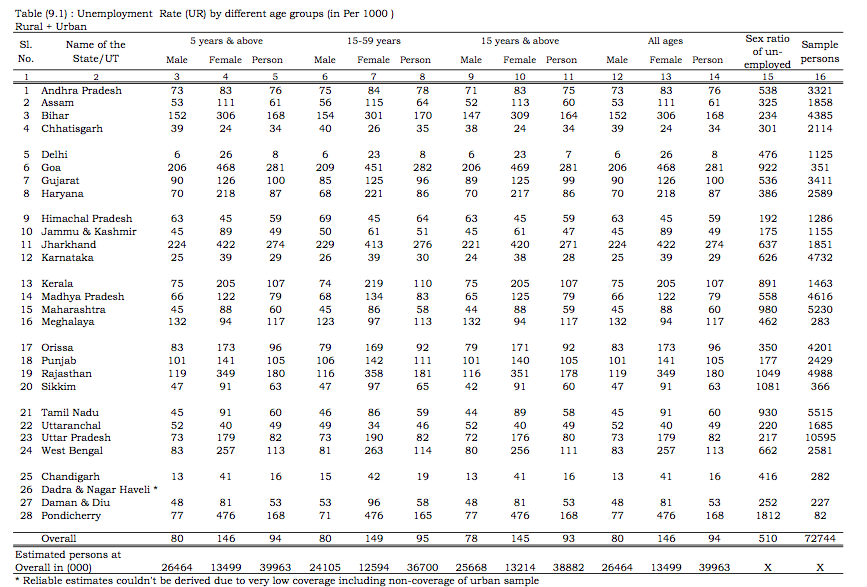
According to this survey – Goa is the state with the highest unemployment rate, and having been in Goa for a couple of years, I know it’s quite a prosperous state, so I won’t be surprised if I am reading the number wrong, but I’m going to dig deeper in the numbers and see what the real cause of that is. Stay tuned for that post, and if you’re interested in a particular state leave a message, and I’ll look at that also. In the meantime, here is the table that shows the unemployment rate for different states (click for a bigger readable picture).

Unemployment in India by State

Also read Unemployment Numbers in US to get a perspective on how other countries calculate this number.

Power Grid FPO Subscription Numbers and Capital Structure

Ritesh Shah had a very interesting question about how many new shares will be issued in the course of the Power Grid FPO, and I thought I’d elaborate the response into a post because there are going to be a slew of disinvestments shortly, and it’ll be good to be familiar with this aspect for future reference.

Let’s take Power Grid’s capital structure for example and see how it works. Before this FPO – these are the number of shares that the government and others held in PowerGrid.

Shareholder

Number of Shares

Percentage of total

Government

3,634,908,335

86.36%

Others

573,932,895

13.64%

Total

4,208,841,230

100%

For the issue, it was decided that the government will sell shares equal to 10% of the existing capital, and issue an additional 10% also.

In this case 10% of 4,208,841,230 is 420,884,123 – which is equal to the number of shares the government is going to sell, and also equal to the number of freshly issued shares.

Number of shares sold by the government: 420,884,123

Newly Issued shares:   420,884,123

This means that post the FPO – the total Power Grid shares will be a sum of the earlier total plus the newly issued shares.

Earlier total: 4,208,841,230

+ Newly Issued Shares: 420,884,123

Total Post FPO:  4,629,725,353

The government will hold shares equivalent to their earlier total minus the shares sold by them viz. 3,634,908,335 – 420,884,12 = 3,214,024,212

Others will hold shares equal to the Earlier total held by others + Number of shares sold by the government + The newly issued shares viz.

573,932,895 + 420,884,123 + 420,884,123 = 1,415,701,141

So, the new structure will look like this:

Shareholder

Number of Shares

Percentage of total

Government

3,214,024,212

69.42%

Others

1,415,701,141

30.58%

Total

4,629,725,353

100%

When they say the total FPO is 20% it means that the total number of shares offered for sale (existing plus new issue) is equal to 20% of the existing capital or pre FPO capital.

The implication of this is that when you issue more shares then your Earnings Per Share (EPS) reduces because now your earnings are spread over a larger number of shares.

When an EPS is reported or a P/E multiple is quoted it is most of the time pre – issue EPS, so that doesn’t take into account the equity dilution due to the new issue of shares. Normally, when an analyst takes equity dilution into account they mention it, so if someone is quoting an EPS or P/E multiple without actually saying that they are taking into account the fresh issue – it is very likely that they are not considering it.

All data from the red herring prospectus

Power Grid FPO Subscription Numbers

The number of shares that are offered during a FPO are reserved for various categories like Qualified Institutional Bidders, Non Institutional Investors, Retail Investors and Employees.

When an issue is oversubscribed the number of shares you get depends on the demand in your own category. For example – the Coal IPO saw very low employee subscription, and an over subscription in all other categories, which means that even though the issue was over-subscribed overall – employees should have gotten the number of shares they bid for, while others got a lesser percentage.

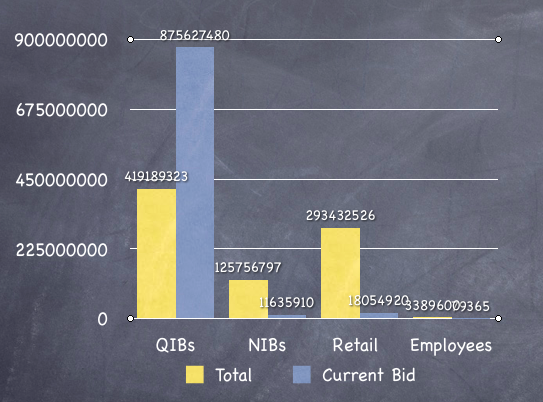
At the end of day 1, here is the demand data for the various categories for Power Grid from the NSE website.

PowerGrid FPO Subscription Numbers

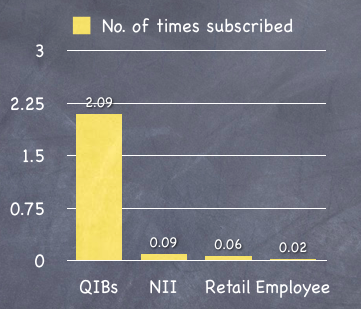
The subscription ratio is not very clear from the above chart, so here is a chart with just the subscription ratio from the same data.

Power Grid FPO Subscription Numbers

The data above confirms the commonly known fact that retail investors wait till the end, and you can see that it’s the institutional investors who have already subscribed twice their quota. As the days go by you will see the retail numbers shoot up, and I’ll update this post regularly to see how that pans out.

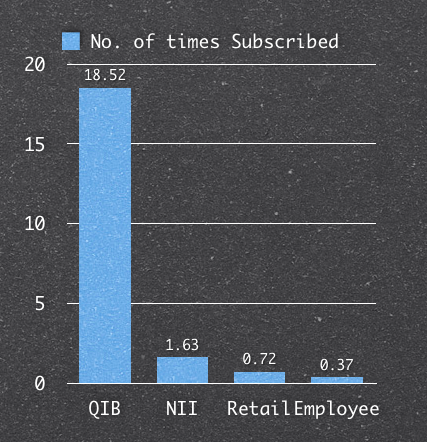
Update: At the end of November 11th 2010 – the numbers have increased for the QIB part quite dramatically, and have inched up for other categories also but not by so much. Here is how they look like. Data from NSE.

Power Grid Subscription numbers on Nov 11 2010

Any comments or feedback?

How to find gold rate in India?

I’ve been asked on how someone can find the daily gold rate in India a few times in the past couple of weeks, and I think there is a little bit of confusion when people see different places selling gold at different prices, and people feel that they’re being cheated or just wonder why there are so many different prices.

You see different gold rates at different places because some websites show the rate of gold futures, some of gold coins, others wholesale gold, and in some cases it is the NAV of a gold ETF.

To make matters worse, there exists a difference even when the same thing is being sold. So, you can expect a price difference between the gold coin between from one jeweler to another, between various banks, and of course between a bank and a jeweler.

When you decide to buy physical gold – make sure you find out where you are going to sell it after-wards. It is not correct to assume that a higher price at the time of buying will lead to a higher price at the time of selling too.

You could face a situation where you paid a premium to buy gold, but had to sell it off at a discount, so make sure you research where you are going to sell your gold very carefully before you make your buying decision.

Given all this – here are some options on where you can look for gold rates in India.

Track daily prices of gold

If your goal is track the day to day movement of gold, then the most convenient way for you is to add a gold ETF in your online portfolio tool like Rediff Money Portfolio or Moneycontrol’s portfolio.

This will give you a good measure of how gold prices have moved in the past because Gold ETF NAVs reflect the underlying gold they hold. However, this price is only good to track movement of gold and not buying physical gold because these are prices specific to the ETFs. So, if you add the Quantum Gold ETF to your portfolio then one unit of that ETF reflects half a gram of gold, but you can’t really buy a half a gram gold coin, though I think some banks were giving half a gram gold coin free with bigger purchases some time ago. Did anyone get a free gold coin like that?

If you don’t want to create a portfolio specifically for this then the link below will show you the NAV of Benchmark gold ETF.

S. No. ETF NAV on Nov 8 2010 Source
1. Benchmark BeeS 1967.73 Link

Buy Gold Coins

If you want to find gold rate in India because you are interested in buying gold coins, then you will have to use a combination of online and offline search.

The online search works for banks which sell gold coins like SBI because you can see the rate of SBI’s gold coins online on their website, which gets updated frequently.

However, the rate of post office gold coins are not available online, so you will have to necessarily go to a post office to find out the post office gold coin rate.

I haven’t found any prominent jewelers displaying their gold coins rate online, so you will have to visit your nearest showroom to see what the going rate is, or if you know of a place online then please leave a comment, and I’ll update the post.

Here is a list of banks selling gold coins, and links to their prices online. Keep in mind that these gold coins are sold by banks at a premium, and they don’t buy them back, so you will have to go to a local jeweler to sell it. Several readers have faced trouble doing this because the jeweler insists on deducting a greater percentage than they would have on gold coins sold by their own shop. So, please research this carefully before making any purchase decisions.
Apart from this all major newspapers publish gold rates, and you can view it on their site, so if you click on Business Line’s website – you will see the day’s gold rate on the top right.

S. No. Bank

20 gms gold coin Price on 8th November 2010

Source

1. HDFC Bank (includes sales tax, whereas the other banks below don’t)

47,549

Link

2. SBI

43,285

Link

3. Kotak

45,327

Link

4. Corporation Bank

46,559

Link

5. Bank of Baroda

42,507

Link

6. Bank of India

43,451

Link

Conclusion

Unfortunately, finding something as elementary as the gold rate in India sounds simple enough, but when you dig deep into it, there are several options you have, and that makes the task slightly complicated.

Where you check largely depends on what your end – goal is, and one thing I’d want to emphasize again is that just because you are paying a premium or a higher price at the time of buying gold doesn’t guarantee that you will get a premium at the time of selling also, so make sure you research how are you going to sell your gold before you make any buying decisions.

Liven up your Monday!

Feeling a little grumpy this Monday, after the Diwali celebrations? Grumpy!photo © 2009 Neil Mallett | more info(via: Wylio)

Fear not, – I have just the thing to liven up your day – today I am going to take you through the concept of reverse amortization and zero coupon bond yields – the best recipe to liven up your day after a long weekend.

No, don’t leave; I’m just kidding.

Continue reading “Liven up your Monday!”

Power Grid FPO price band fixed between Rs. 85 – 90

A lot of you have been interested in knowing the price band of the Power Grid FPO, so I thought I’d do a quick post when I saw MSN India report that the Power Grid FPO price band has been fixed at Rs. 85 – 90.

I think this should cheer a lot of people, as I saw a few tweets that showed people will be interested in a price below Rs. 100.

There is of course a 5% discount for retail investors, so that brings down the effective price a bit more. The issue will open on 9th November, and close on 12th November for retail investors.

Click here to read some key Power Grid FPO numbers

Click here to read how Power Grid performed since listing

Nov 6 2010 Weekend Links

I hope you had a safe Diwali, and here are some interesting links I found this week.

First up – this great infographic from Mint.com explaining capital gains.

Mint.com Personal Finance Software

Other links:

List of deals struck by Mr. Obama on his India visit from the WSJ blog

Sandip Sabharwal’s musings on Diwali and the road ahead

Bad Money Advice on Retirement Calculators

The Digerati Life’s checklist for home buyers

The Economist on Quantitative Easing

And The Weakonomist on How the Fed Creates Money?

Enjoy your Sunday!