Bad news and worse news

This has been a rather depressing week with bad news flowing in from all directions and that started with Kapil Sibal asking Google, Facebook, Microsoft and Yahoo! to screen user content and stop objectionable content from appearing on their websites.

This is ridiculous of course and will never see the light of day, but unfortunately, FDI in multi – brand retail has been killed and I guess we will have to wait for a crisis till this issue is raised again. The best thing I read about this was Bloomberg’s article titled Wal-Mart battles with Marx’s ghost in India. 

This week also saw the UID project getting derailed, but cheer up it’s just 550 crores or so down the drain! Nothing compared to the 30,000 crore or so that will go down the drain in Air India’s bailout.

The third thing that got derailed this week was allowing 49% FDI in Insurance.

This coupled with a weak rupee, widening trade deficit, high fiscal deficit and slowing growth makes beyondbrics ask if India is in crisis yet.

Yet is probably the operative word there, and the way things are going you get a feeling that it’s only a question of when and not if.

Jim O’Neill – the Goldman Sachs economist who coined the term BRIC said this week that India has been the most disappointing of the 4 countries, and here is what he had to say.

All four countries have become bigger (economies) than I said they were going to be, even Russia. However there are important structural issues about all four and as we go into the 10-year anniversary, in some ways India is the most disappointing

That’s it for this week!

Overview of the Direct Tax Code

Direct Tax Code (DTC) is supposed to be implemented from the next financial year, but there hasn’t been much news on it lately, and people are beginning to doubt if it will be implemented next year or be delayed even more.

I don’t think it’s a bad thing if it does get delayed because the main premise behind the DTC was that it will simplify the current tax code, and while the first draft was superb, the subsequent revisions have made it somewhat complex.

I think this is best epitomized by the way capital gains on shares is calculated where they will reduce the value by a specified percentage first and then add that to your income. Who comes up with these percentages and why tax people on capital gains on shares now when you haven’t done it earlier?

The first draft of the DTC had tax slabs much higher from the current ones, but the revisions made the slabs come down as well, so even that benefit doesn’t exist to the same extent as earlier.

I have written a few posts about changes related to DTC but they are not very easy to find and when Sowmya left a comment about a primer on DTC – I thought it will be a good idea to have a post that links to the various other posts that I have written on DTC and gives a summary of the changes.

The following table lists down the various changes that will come with the DTC.

S.No. Head Details 
1 ELSS Mutual Funds These mutual funds that were covered under Section 80C and gave tax relief will no longer reduce your taxable income. The lock in period in the funds will probably be removed, and in some cases the fund sponsor may even merge them with other bigger funds.
2 Double Indexation Benefit on FMPs Holding period will be calculated from the end of the financial year instead of the date when you buy the units so that means double indexation benefit on FMPs will no longer exist.
3 Long term Capital Gains on Shares Presently, there is no long-term capital gain on shares but in the future capital gains will be charged using a fairly involved formula.
4 Short term capital gains on shares Presently, it is 15% of the gain, but in the future it will be taxed on the slab of the investor.
5 Wealth Tax Wealth Tax will be charged if wealth is assessed at more than 50 crores.

You can click through the links in the above table to read more details about each of these topics, and as more clarity comes in about DTC and other topics get added – I will link them through this table as well.

Thoughts on financial advice

I’ve read a number of articles talking about paid financial advice lately, and I get emails from readers asking about some services as well, and I’m writing this post as a result of those questions and what I’ve seen here over the years.

My general impression is that good financial advise is rare, and when available it is not easily affordable.

I have interacted with a large number of people who call themselves financial advisers in the course of writing this blog, and my perception is that a lot of them have no clue of what they are talking about.

There are people like Shiv, Hemant, and Furqan who are extremely knowledgeable, and also unbiased, but for a lot of others – I wouldn’t take their advice if they paid me, let alone me paying them.

If  you end up with one of these advisers then you are screwed out of your money because most often, the folks who know little are also guided by fat commissions and will suggest only those products that will fatten their wallets the most.

I also think that you need to figure out a lot of this stuff on your own. If you really want to be financially successful – you have to have some things figured out like the importance of having no credit card debt, value of term insurance over other plans, benefits of diversification, asking about risk when someone talks about returns, and other such important things.

They are simple concepts if you are willing to give the time to learn them and there is a lot of information already available for free in the public domain about these topics.

If you understand these things then you are already quite ahead of the game and if and when you do take financial advise – you will be able to extract the maximum out of the consultation and really benefit from it.

You don’t need paid advice to tell you that you should have zero credit card debt or that you should have some money in equities or the benefits of diversification, but if you don’t know about these things then your adviser will need to spend time to explain these things to you and that’s time taken away to move on to more advanced things like planning for goals and all that good stuff.

This is not to mean that there is no value in financial advise – I truly believe there is and that’s best showed by a comment Deepak left here some time ago. Let me reproduce that here:

Hi Manshu,

I would like to take opportunity to thank you for giving Nisha a really wonderful gift
(comprehensive financial plan by “Hemant Beniwal”), this is just not worth Rs 15000, it is really undervalued b’cos this is a gift for the lifetime.

I must tell you that Hemant is really a true professional to work with, he has immense knowledge in the field and his concepts are really very clear, he has given very clear paths to achieve our goals. He got so involved in the plan..I felt that my elder brother was teaching me the way of taking financial decision in life..thank you Hemant for great advice and i’ll always remember ‘if you can have honeymoon in manali don’t think of goin to Mount everest.’

I would once again thanks “One Mint” for giving our life a great direction. I wish you both all the success in life.

Kind Regards
Nisha/Deepak

Clearly shows the benefit, and in my view you will benefit from it when everything falls into place – you meet an adviser who is knowledgeable, has a long term approach, most likely such a person will have a good fee, so you should be able to afford to pay the price, and finally you should have a lot of the basic and important stuff figured out already so you can make the most of your consultation.

An update on ELSS tax saver mutual funds

I did a post about some of the better performing ELSS tax saver mutual funds in January this year, and I thought I would revisit those funds to see how they fared during these tough market conditions.

I wanted to see if there was any big variation between these funds, and if there was any way to predict some of that variation at the beginning of the year.

First, the original list of ELSS mutual funds that were around for 5 years or more and had performed well.

Keep in mind that these returns are for a 5 year period ended in January 2011.

Name Inception Date 5 year returns Expense Ratio
Birla Sun Life Tax Relief – 96 March 1996 16.57% 1.96
Canara Robeco Can Equity Tax Saver March 1993 22.31% 2.38
HDFC Tax Saver March 1996 17.80% 1.86
ICICI Prudential Tax Plan August 1999 15.48% 1.98
SBI Magnum Tax Gain Scheme – 93 March 1993 16.32% 1.78
Principal Personal Tax Saver March 1996 16.42% 2.19
Franklin India Tax Shield April 1999 17.34% 2.10
Sundaram Tax Saver Nov 1999 17.73% 1.96
Sahara Tax Gain March 1997 22.31% 2.50
Reliance Tax Saver August 2005 15.14% 1.88

I had deliberately kept the list in no particular order because as soon as you order it according to something – say the highest returns – the brain starts telling you that the first fund is the best, and the last fund is the worst – which is what I wanted to avoid.

Now, let’s take a look at how these funds performed in the last 1 year.

Name Inception Date 1 Year Returns Dec 3 2011 Expense Ratio
Birla Sun Life Tax Relief – 96 March 1996 -23.21% 1.96
Canara Robeco Can Equity Tax Saver March 1993 -10.95% 2.33
HDFC Tax Saver March 1996 -17.28 2.07
ICICI Prudential Tax Plan August 1999 -15.14 1.98
SBI Magnum Tax Gain Scheme – 93 March 1993 -17.06 1.81
Principal Personal Tax Saver March 1996 -22.35% 2.22
Franklin India Tax Shield April 1999 -8.26% 2.07
Sundaram Tax Saver Nov 1999 -18.43% 1.95
Sahara Tax Gain March 1997 -16.33% 2.50
Reliance Tax Saver August 2005 -19.31% 1.89

All data from Value Research

There is quite a lot of variation in this list, and the Sensex has returned -17.50% in this time period so anything near that number is what you would expect.

The only two funds that were markedly better in this comparison were Canara Robeco Tax Saver and Franklin India Tax Shield.

So, why did these two funds do so well?

I looked at the portfolio of Canara Robeco Tax Saver and Bharti Airtel is their biggest holding with 7% weight in the portfolio, and that stock has returned about 12% in the last year and I think that one stock had a lot to do with Canara’s good performance.

In Franklin India Tax Shield’s portfolio – I see that Infosys is the biggest component at 8.5% which fell only 5% in the last one year period, then Bharti Airtel is the second biggest component at 7.5%, and ICICI Bank is the third largest component which fell 33% in the last year! They also hold Idea Cellular which was just 1.49% of their portfolio in March but grew to 3.5% of the portfolio by September. Idea Cellular has risen about 37.50% in the last year.

Frankly, I’m having trouble explaining why they did so well in hindsight, so it’s pretty clear to me that I could have never picked these two mutual funds at the beginning of the year to say that they will be ones that will perform better than the rest.

So, yes, there was variation, but there is nothing that I can see which would have indicated at the beginning of the year which funds would do well and which won’t.

Finally, let’s place the best performers in both time periods in one table and look at them side by side.

As on Jan 2011

As on Dec 2011

Name 5 year returns Expense Ratio Name 1 Year Returns Dec 3 2011 Expense Ratio
Canara Robeco Can Equity Tax Saver 22.31% 2.38 Franklin India Tax Shield -8.26% 2.07
Sahara Tax Gain 22.31% 2.5 Canara Robeco Can Equity Tax Saver -10.95% 2.33
HDFC Tax Saver 17.80% 1.86 ICICI Prudential Tax Plan -15.14% 1.98
Sundaram Tax Saver 17.73% 1.96 Sahara Tax Gain -16.33% 2.5
Franklin India Tax Shield 17.34% 2.1 SBI Magnum Tax Gain Scheme – 93 -17.06% 1.81
Birla Sun Life Tax Relief – 96 16.57% 1.96 HDFC Tax Saver -17.28% 2.07
Principal Personal Tax Saver 16.42% 2.19 Sundaram Tax Saver -18.43% 1.95
SBI Magnum Tax Gain Scheme – 93 16.32% 1.78 Reliance Tax Saver -19.31% 1.89
ICICI Prudential Tax Plan 15.48% 1.98 Principal Personal Tax Saver -22.35% 2.22
Reliance Tax Saver 15.14% 1.88 Birla Sun Life Tax Relief – 96 -23.21% 1.96

There is very little similarity between one and the other – what did well in the first five year period didn’t necessarily do as well in this year. Perhaps the one fund that catches the eye is Canara Robeco Equity Tax Saver because it is near the top for both these time periods, but it’s anybody’s guess if it would continue with it’s good performance or not.

If I had to pick up a tax saver mutual fund – I would pick two or three out of this list, but I don’t think it is possible to narrow it down any further.

IFCI Tax Saving Long Term Infrastructure Bonds – Series IV

The latest company to offer 80CCF infrastructure bonds is IFCI, and they also happen to have the highest interest rate (but not by that much).

The 10 year option offers 9.09% which is 9 basis points higher than the IDFC and L&T Infrastructure issue, and the 15 year option has 9.16% which is 16 basis points higher than the other issues.

Since this issue is unsecured as opposed to the other issues that were secured, and the credit rating of this issue is lower than the other ones – I would think that this extra bit of interest rate isn’t enough of a sweetener to make a change in anyone’s preference.

The issue opened on the 30th November 2011 and will close on January 16 2012, so of all the issues that have come out so far – this one will remain open the longest.

There haven’t been any additional questions about infrastructure bonds since the last time I wrote about them so I will keep this a short post, and present the key information of this issue in the table below.

Series

1

2

3

4

Face Value

Rs. 5,000

Rs. 5,000

Rs. 5,000

Rs. 5,000

Interest Payment

Cumulative

Annual

Cumulative

Annual

Coupon Rate

9.09%

9.09%

9.16%

9.16%

Term

10 years

10 years

15 years

15 years

Buyback option

At the end of 5th and 7th year

At the end of 5th and 7th year


Like the other bonds – these one will list on the stock exchange after the initial 5 years are over and they will list on the BSE.

I can’t think of adding anything else, but if you have any questions or observations then please leave a comment.


What is the difference between mutual funds and ETFs

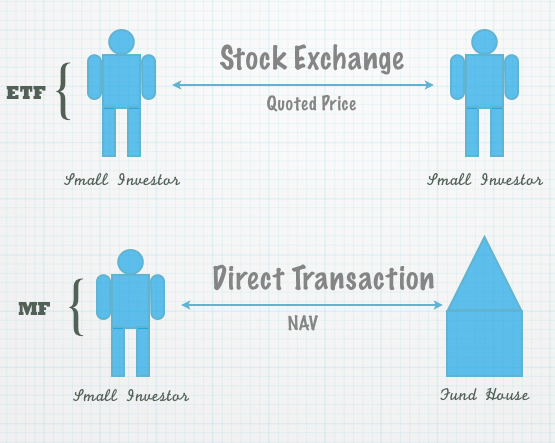
The first difference between an ETF and a mutual fund is that when you buy an ETF you buy it from someone else in the market, and not the ETF trust – however, when you buy a mutual fund you buy it directly from the fund house. In this respect an ETF is like a share that trades on the stock exchange.

The following picture should make this clear.

Buying an ETF vs Buying a MF


When you buy a Reliance share from the stock market – Reliance Industries doesn’t get the money, and much in the same way when you buy an ETF from the share market – the ETF trust doesn’t get the money.

These units are being bought and sold between people in the secondary market and that’s different from mutual fund units. When you buy a mutual fund  – the fund gets your money, and issues you units based on the NAV on that day.

Now, the question is if you are buying and selling the ETF units from other small investors like you then where are the units coming from in the first place?

These units are being sold to you by what’s known as Authorized Participants who are large dealers / brokers / jewelers or other institutional players.

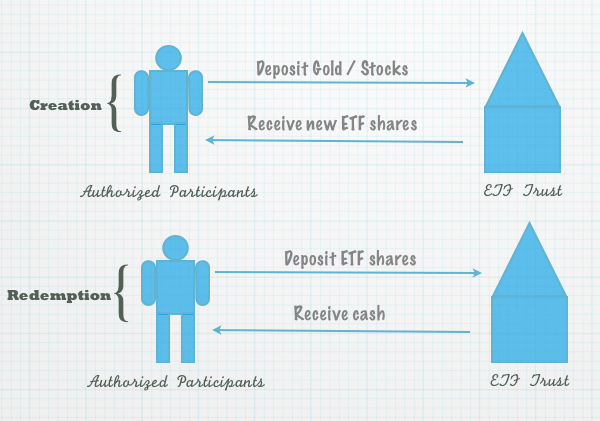
The Authorized Participants have the ability to buy and sell units directly from the ETF sponsor, and this process is called “Creation” and “Redemption”, and the units that are created like this are called “Creation Units”.

These creation units are very large in size, for example for a gold ETF liked Goldbees – the creation unit is one kilogram of gold, so the Authorized Participants needs to deposit one kilogram of gold with the ETF sponsor, and then the ETF sponsor creates new shares of their ETF and issues them to the Authorized Participant.

The Authorized Participant can then take those shares and sell a thousand of them in the stock exchange to thousand different small investors and thereafter these thousand investors can trade these units among themselves on the stock exchange.

Similarly, the Authorized Participant can take their ETF shares and redeem them with the ETF sponsor in exchange for cash.

This process is shown in the picture below.

Authorized Participants - Creation and Redemption of ETF Shares

To create new ETF shares, the authorized participant needs to deposit stocks or gold to the ETF trust and in exchange the ETF trust creates new shares and issues it to them. They in turn sell these shares on the stock exchange to the general public.

In that context, it’s important to keep in mind that when you go to buy a gold ETF or Nifty in the stock market – that has no effect on the gold holding or Nifty stock holding of the ETF trust. That’s only affected by the issue and redemption process of authorized participants.

This process also helps keep the NAV close to the traded value of the ETF because the authorized participants can arbitrage and make money whenever there is a difference between the two.

This is the fundamental difference between the structure of ETFs and mutual funds, and if you figure this out then the rest of the stuff is fairly easy. Here is a table that highlights some of the other differences / similarities between the two.

Feature Mutual Fund ETF
Traded on a stock exchange MFs are not traded on stock exchanges and you have to buy them directly from the fund house. ETFs are traded on stock exchanges and you can buy and sell them on the exchange.
NAV or Quoted Price MFs can only be bought and sold at their NAV ETFs have NAVs and all ETFs show their real time NAVs on their websites. However, since they are listed, you can buy them on the quoted price.
Trading account needed You don’t need a share trading account to buy a mutual fund. Since ETFs trade on the market, you need a trading account to transact in them.
Expense Ratio Expense ratios on mutual funds are generally higher, especially because a lot of them are actively managed. Expense ratios of ETFs tend to be lower since they are passive in nature.
Brokerage Since you buy mutual funds directly from the fund house you don’t have to pay any brokerage on it. You will have to pay the brokerage on ETF transactions since

At the end of the day, both ETFs and mutual funds are investment vehicles that let you take a position on an asset class without exposing yourself to too much of one company’s shares or bonds. There are differences but the goals of both the products are the same.

This post is from the Suggest a Topic page. 

I can out work you

Last weekend I read Mark Cuban’s short book How to Win at the Sport of Business, and loved it.

It’s really a collection of his blog posts strung together in a manner that tell the story of how he rose in the world.

The most important message that I took away from that book was to work really really hard. There were plenty of other things too but this one resonated the most with me.

Then this week I came across this interview of Mayor Bloomberg and he pretty much said the same thing.

Here is what he said:

I am not smarter than anybody else but I can out work you – and my key to success for you, or anybody else is make sure you are the first one in there every day and the last one to leave. Don’t ever take a lunch break or go to the bathroom, you keep working. You don’t ever know when that opportunity is going to come along.” He continues, ”every opportunity I ever had, it was I think an awful lot of them was because I was there at the time. And that is the one thing you can control. You can’t control your luck, but the harder you work, the luckier you get.

Here is the video:

Pretty amazing stuff!

Game Changing Kinect, Rupee FAQs and Europe Simplified

The Smithsonian blog talks about the amazing possibilities that Microsoft’s Kinect presents. I was amazed when I first saw Kinect in action, and if they really come up with one that can recognize facial expressions, and read your lips – that will be quite incredible!

The ideas discussed in that post are quite exciting and I quite like the thought of not having to fiddle with a TV remote control and just wave my hands and control the TV from a distance.

The way technology is evolving – it doesn’t sound like a far fetched idea at all.

Ajay Shah has a great post on the frequently asked questions on the rupee, very relevant and informative, especially given the massive action in the Rupee exchange rate these days. This is a good post for anyone interested in the topic and also lays out in good detail why the government can’t just wave a wand and bring the exchange rate down.

Another excellent post – this one on explaining the European debt crisis with 8 simple graphs. This one does the best job of explaining the crisis in a way that’s easy to understand and holistic.

More on Europe, the NYT has a great article titled European Crisis in Plain English that explains a lot of the complex things going on there in simple words.

Together, these two articles go a long way in building an understanding of the European situation.

The markets have been bad this year, and I think most people have seen much worse returns than the indices, and that’s true for hedge funds also. Economist reports that while S&P fell 3.8% year to date – the average hedge fund has fallen about 9%.

Business Standard reports on the huge cash mountain that India Inc is sitting on.

Finally, Hemant on how mutual funds are taxed.

Enjoy your weekend!

IDFC and L&T Infrastructure Bonds Application Download Link

A few people  have left comments about not being able to find the application forms of infrastructure bonds, so I was glad to see that Shiv had created a download link with both these application forms, and you can download them here conveniently.

Here is the comment that he left about it:

“As the corporate employees have been getting mails from their HR departments to submit Investment Proofs as per their Tax Declaration, I think Tax Planning season has officially kicked off from today. I’ve also been getting a large no. of calls from people for investment in Infrastructure Bonds. Many of these people are not able to get the application forms to invest in these bonds. So, I asked my associates – SBI Capital Securities to provide me an online link which I can share with my investors/clients. To help with the matters, I’m sharing this web link with all the readers of OneMint. I request you also to please check this link once & let me have your view about it.

For IDFC Infra Bonds: http://sbicapsecu.co.in/pdfstamping/PDFBondMaster.aspx?SubBrokerName=ShivKumar%C2%A0Kukreja

For L&T Infra Bonds:
http://www.sbicapsecu.co.in/pdfstamping/LNTINFRA_ShivKumarKukreja.aspx

The link takes the investors to an 8 pager application form. Investors can print the first page of the form, which is to be filled & submitted along with other relevant docs. They can also check other relevant info which is there on the ramaining pages like collection centres, Lead Managers, Lead Brokers, Financials of the Issuer, Risk Factors etc.

In case any reader has any query regarding this link (E-Form) or wants to invest in Infrastructure Bonds – IDFC or L&T, Call/SMS 1800 3454 001

On a different note, Deepak commented asking why the yield on the annual interest payment is more than the yield on the cumulative one, and I wouldn’t rely too much on those numbers because of the limitations with the way those are calculated (last year’s post).

Basically, this difference shows just in the way the the different yields are calculated in the YTM versus the CAGR method plus they don’t really account for the tax you have to pay on the interest but do include the tax benefit you gain from the investment!

If you’re interested then here is the cash flow from both methods for the 30.9% tax bracket.

Annual Interest Payment

Time Period

Cash Flows

0

-3455

0.1937

1.1937

0

1

-3455

1

450

0.1937

1.1937

1

1.1937

376.98

2

450

0.1937

1.1937

2

1.42491969

315.81

3

450

0.1937

1.1937

3

1.700926634

264.56

4

450

0.1937

1.1937

4

2.030396123

221.63

5

5450

0.1937

1.1937

5

2.423683852

2248.64

 YTM

19.137%

Total Cash Flow

-27.37717

Cash Outflow

3455

Cash Inflow

7250

Difference

3795


Cumulative Payment

0

3455

0.1737

600.1335

1

4055

0.1737

704.3767

2

4760

0.1737

826.7269

3

5586

0.1737

970.3294

4

6557

0.1737

1138.876

5

7695

Yield

17.37%

Cash Outflow

3455

Cash Inflow

7695

Difference

4240

As you can see the yield is higher in the first option but the absolute difference in cash is more in the second option. If you’re not sure of how I arrived at these numbers then go through last year’s post on how issuers were calculating effective yields for tax saving infrastructure bonds.

How is GDP calculated in India?

The Q2 2011 GDP estimates came out yesterday, and I thought it will be a good time to do a post on how the GDP numbers are calculated in India.

GDP is calculated by the Central Statistics Office and the first set of numbers that come out are the quarterly estimates, which are later revised to show the final numbers.

This information is released on the Ministry of Statistics and Programme Implementation website, and you can access it there on the right side in the “Latest News” section.

GDP can be calculated in several ways, and in India the GDP is calculated in two different ways, and then one number at market prices and the other one at inflation adjusted prices.

So, effectively, every time the GDP is released, there are 4 different numbers for GDP that are released. If you see the latest release, you will find the following four GDP estimates in the report.

GDP Criteria

Q2 2010

Q2 2011

Growth Rate

QUARTERLY ESTIMATES OF GDP AT FACTOR COST IN Q2 (JULY-SEPTEMBER) OF 2011-12
(at 2004-05 prices)

1,148,472

1,227,254

6.9%

QUARTERLY ESTIMATES OF GDP AT FACTOR COST IN Q2 (JULY-SEPTEMBER) OF 2011-12(at current prices)

1,685,793

1,955,880

16.0%

QUARTERLY ESTIMATES OF EXPENDITURES OF GDP AT MARKET PRICES IN Q2 (JULY-SEPTEMBER) OF 2011-12 (at 2004-05 prices)

1,237,610

1,321,038

6.7%

QUARTERLY ESTIMATES OF EXPENDITURES OF GDP AT MARKET PRICES IN Q2 (JULY-SEPTEMBER) OF 2011-12 (at current prices)

1,801,957

2,085,315

15.7%


GDP AT FACTOR COST

If you see the table above, you will see that the first row contains what’s called the GDP at Factor Cost at 2004 – 05 prices, and from the growth rate of 6.9% – you can see that this is the number that is reported in the media.

This number is derived from using the Production approach and this method breaks down the economy into different sectors and then computes the value that has been added in each sector.

For the latest year, this is the table that shows this value.

Industry

GDP Q2 2011 – 12 (Rs. in crore)

Agriculture, forestry and fishing

135,789

Mining and quarrying

24,774

Manufacturing

192,849

Electricity, gas and water supply

25,137

Construction

95,489

Trade, hotels, transport and communication

342,080

Financing, ins., real est. and business services

230,627

Community, social and personal services

180,511

GDP at factor cost

1,227,254

Looking at the data this way is useful to see which sectors of the economy are growing, and which are lagging.

These numbers are at 2004 – 05 base prices which means they have been adjusted for inflation and the same numbers are calculated at current market prices as well, and that’s what’s shown in the second row of the first table.

Expenditures of GDP at Market Prices

The second way of calculating GDP is called the Expenditure Approach and this method aggregates the following things:

  1. Household final consumption expenditure (C): This is the expenditure incurred by Indians on consuming goods and services.
  2. Government expenditure (G): This is the money spent by the government on its activities.
  3. Gross Capital Formation (I): This is the investment that’s taking place in the economy.
  4. Exports Less Imports(X): The value of exports minus imports in that time period.

You will see this denoted as: GDP (Y) = C + I + G + X

This is how the latest numbers looked like:

Item 2011 Q2
Private Final Consumption Expenditure (PFCE) 785,463
Government Final Consumption Expenditure (GFCE) 140,883
Gross Fixed Capital Formation (GFCF) 402,994
Change in Stocks 45,499
Valuables 37,681
Exports 333,947
Less Imports 395,512
Discrepancies -29,918
GDP at market prices 1,321,038

Since GDP is calculated using two different methods – both the numbers are different, and this is true for every time period.

Looking at the data this way shows you which parts of the economy contribute the most.

So, from this table you can see that consumption forms the major part of the Indian economy and that’s the reason we remain relatively insulated when there is a global slowdown. If you saw the numbers for an economy that had a lot more exports than imports then that would be impacted a lot more than India got impacted during the last recession and even now.

That’s what happened in China, and to overcome the slowdown they had from exports they boosted government spending which in turn boosted the GDP growth.

Conclusion

Both sets of numbers are useful to look at, and which number you look at depends on what you are trying to identify. To look at how various industries are doing – GDP at factor cost is useful, and to look at the impact of macro policies – the second table is useful since it shows if investments have slowed down, or the government spending has increased and those type of things.

More significantly, people are looking for trends in these numbers, and the trend has been terrible of late.

I tweeted this out earlier in the day, which I think sums up the situation quite clearly.

“6.9%, 7.7%, 7.8%, 8.3%, 8.9%, 9.3%, 9.4% –> India GDP growth each qtr, last 7 qtrs. Serious downwards slide.”

The slowing growth is not getting enough attention and I hope this slide is halted before it comes close to a point where you’re actually looking at a contraction in the economy.

This post is from the Suggest a Topic page.Â