Features of the US Immigration Bill of interest to Indians

The US has recently introduced a bill on immigration and since US is the second largest home to Indian diaspora with about 3 million people of Indian origin residing there – this bill is of a lot of interest to Indians.

The bill is named  “Border Security, Economic Opportunity, and Immigration Modernization Act” and it is still a long way from becoming law and according to the NYT it is too early to predict when it may get passed. 

The bill is 844 pages long, and the primary focus is on immigrants who are already present in the US illegally, and providing them a way to citizenship. To that extent, large sections of the bill are not relevant to Indians, and in this post I’m going to discuss the parts of the bill which will have some meaningful impact on Indians.

 1. Increase in the H-1B Visa Limit: Currently, the limit on H-1B visas is 65,000 per year for regular cases and an additional 20,000 for advanced-degrees. This limit got exhausted within 5 days this year as 124,000 petitions were filed within that time frame.

The bill proposes to increase the limit to 110,000 and the cap for advanced-degrees will be raised to 25,000. There is a provision in the bill to increase the quota of H-1B visas gradually based on what they are calling the “High Skilled Job Demand Index” and the limit may go as high as 180,000 in later years.

2. Spouses of H-1B Visa holders will be allowed to work based on reciprocity: Currently, the spouse of a H-1B visa worker who gets the H-4 visa is not permitted to work in the US. According to the bill, spouses will be allowed to work if the other country also allows this. As far as I know, India doesn’t allow the spouses of Americans to work in India, so this provision will not be applicable to Indians.

3. US employers to pay higher wages to H-1B workers: There is a concern that on occasion H-1B workers work on lower wages in the US when compared with what an American citizen would have got, and the new bill makes it necessary for the employer to pay them equivalent wage. It will also make it necessary to advertise the H-1B job one month prior to hiring a foreign H-1B worker and give first priority to Americans.

4. Companies with higher H-1Bs to pay more visa fees: If a US employer has more than 50 H-1B or L-1 workers and if they form 30 – 50 percent of the staff then the employer will have to pay an additional fee of $5,000 for each new H-1B. Similarly, if they have more than 50% staff on H-1B or L-1 visa then they will have to pay an additional fee of $10,000 for each new H-1B. After 75%, they will no longer be allowed to get a foreign employee to work in the US.

5. Siblings of US citizens no longer eligible for green card: Currently, US citizens can apply a green card for their siblings as well, but this bill seeks to eliminate that.

I’ve heard chatter from people that the passage of this bill will make it faster for people from India to get green cards under the EB-2 and EB-3 category, but there is nothing in the bill about that, and it is unlikely that anything will be added to make that long wait shorter.

I couldn’t find anything else that felt like it would be of significant interest to Indians, but if you see anything please leave a comment and I’ll update the post.

Also, worth repeating that none of this is law yet and there is still a long way to go.

Where can Indians living in the US invest?

I had a lengthy conversation with a friend who currently lives in the US, and wanted to start investing. We touched upon various options, and I thought it would be a good idea to do a quick post with the broad outlines of our conversation. We spoke about investing options at length but before you get to those, you should ponder on the following two questions:

  1. How do you save?
  2. Where will you eventually settle?

How do you save?

The first thing I asked her was how do you save? This might sound like a strange question but I’m a great believer of saving first, and spending later. If you don’t have a way to auto debit some money into your savings account, you should give it a try. Set a fixed amount every month or even every fortnight that automatically goes to your savings account or your brokerage account and forget about the money.

If you wait to invest only what’s left after spending you will miss out on several opportunities to save that you didn’t even know existed. Without saving, there is no investment, so thinking through a plan for savings is necessary in order to build any sort of wealth.

Where will you eventually settle?

For a lot of NRIs this is a difficult question – and in my experience if you don’t feel strongly about returning to India, I’d say assuming that you will stay in the US for a long time is a safe thing. This matters because you should have access to funds in the country you plan to stay, and there is no point of owning a house in India if you are never going to live in it. Better keep the bulk of your investments close to where you are.

Answering the two questions above will help you evaluate whether the options listed below are appropriate for you. With that said, here are some options that Indians living in the US can invest in.

1.  Real estate in India: If I were to do a poll of all my friends living in the US, I think the number one investment option that would come to the fore is real estate in India. There is hardly anyone who doesn’t own a plot or a flat somewhere in India, and at least on paper almost all of them have appreciated. This is perhaps the most popular investing option for Indians in US.

2. Real estate in US: I’m mentioning it here only to maintain continuity, as I feel buying real estate in the US as an investment is not as popular today as it was before the crash of 2008, but regardless, this is an option available to you.

3. Buying Gold Coins: Buying gold coins is a lot easier and efficient in the US than it is in India, as you can sell them easily later one without the fear of a jeweler screwing you out of your money, and that has been a popular investment also.

As you can perhaps tell, so far none of these are investment options that I recommended to my friend.

4. NRE Fixed Deposit Account in India: NRIs and Indians living in US can open a NRE fixed deposit account, and this is a good option if you think you will need money in India at some point. You will be able to get 8 or 9 percent tax free, and that’s a really good rate of return on a very low risk investment.

Now, a lot of people compare the 0 percent interest rate you get in the US to the 9 percent you get in India without considering the difference of inflation in the two countries, and without the effect of exchange rates. I sometimes see people transferring money to India and being unhappy with an exchange rate of Rs. 54 or Rs. 55 and these guys don’t realize that just a few years ago people were transferring money in 40s and sometimes even the late 30s. If you are going to need money in the US in a few years, and the INR depreciates even more then the difference in interest rates isn’t going to help you at all.

So, this is one thing to be careful about.

5. Buying stocks and mutual funds in India: NRIs can open a Demat account that is linked to their NRE or NRO account and then invest in some select stocks and mutual funds. That is one option for people who want to invest in the Indian market and are comfortable with equities.

6. Buying India based ETFs listed in the US: There are several ETFs that are listed in the US that invest in securities in India, and you can buy those if you want to get exposure to India. You can open a trading and brokerage account in the US even on a visa and then you can buy ETFs from that account.

7. Buy US based shares or Index Funds: This is not much different from the point above, just that instead of buying funds that have exposure to India, you now buy funds that have exposure to the US. You invest in equities in this too but the underlying is American instead of Indian shares. In the same vein, you can invest in shares that have an underlying in any economy in the world.

8. Buy US based bond funds: My friend wasn’t very comfortable with equities so I said that there are bond funds also that you can invest in. I am not sure how many Indians will do this given the low returns on these but as I said earlier, you can’t really compare this with INR returns as the inflation and exchange rate volatility is different.

Conclusion

I feel that the options are fairly limited and the lack of good debt options makes it so that people either invest in fixed deposits in India, or get used to equity.

My recommendation to her was to get used to equity and begin by opening a brokerage account in the US and buy index funds in small quantities. I suggested that she send some money to her brokerage account every fortnight, and then use half of that to buy one or two index funds. Let the rest lie there for when there is another panic, and then use that money to buy equities when they fall.

This is of course easier said than done and not everyone can do that. I think I’ll be able to help her do this and in a few years time frame, she will be completely bought into equities, and be able to use it to her advantage.

I will be keen to hear what others think of the options I listed out and which ones you think can be added, and what have you done that has worked for you.


What is the difference between FDI and FII?

Vikas posted the following comment on the Suggest a Topic page a few days ago:

Vikas Ganjave March 30, 2013 at 9:13 am [edit]

Can you write an article on difference between FDI and FII citing examples?
Thanks

REPLY

A lot has been written on FDI (Foreign Direct Investment) and FII (Foreign Institutional Investor) already, and I found a great succinct explanation from Business Line explaining the difference between FDI and FII investments as one flowing into the stock market (FII) and the other flowing into the primary market (FDI), and all other differences emerging out of that one key point.

FDI (Foreign Direct Investment) is when a foreign company invests in India directly by setting up a wholly owned subsidiary or getting into a joint venture, and conducting their business in India.

IBM India is a wholly owned subsidiary of IBM, and is a good example of FDI where a foreign company has set up a subsidiary in India and is conducting its business through that company. What’s amazing about IBM is that, it is now the largest Indian IT company in India. It is serving Indian customers, and a large domestic market that was not tapped by the Indian players themselves.

Foreign companies partnering with Indian companies to set up joint ventures is more typical and Starbucks partnering with Tata Global Beverages Limited is a recent example of FDI through joint venture, but there are several others in the insurance, telecom, food industry etc.

FII is when foreign investors invest in the shares of a company that is listed in India, or in bonds offered by an Indian company. So, if a foreign investor buys shares in Infosys then that qualifies as FII Investment.

It is easy to see why you would prefer FDI to FII investments. FDI investments are more stable because companies like IBM set up offices, hire employees, and have a long term plan for the country. IBM can’t just pull out a few million dollars from India overnight, which is what FII investors do from time to time and that leads to market crashes.

In India, attracting FII has been easier than FDI because of the policy uncertainty and procedural delays. An RBI study has the following para on FDI slowdown and it is easy to see how it is tied to the politics in the country.

“Procedural delays are bothering nearly all of the respondents with almost 93 percent of the respondents indicating this issue to be ‘quite to very serious’. The time consuming systems and procedures to be complied with, the bureaucratic layers to be dealt with and the multiple bodies from which clearances are to be obtained- all add up substantially to the transaction cost involved and take up a lot of management time thus making it an issue of serious concern for the investors” (FDI Survey by FICCI, December 2010).

Both FDI and FII investments are good for the economy, but I feel that FDI is where the focus should be and this is where India is lagging behind badly. There are several things that can be done to improve FDI investments, and hopefully, things will get done before India hits another crisis.

What is the difference between core inflation and headline inflation?

Mohit Golchha asked me what “core inflation” was a few weeks ago, and I thought this was an interesting topic that merits a post.

However, core inflation can only be understood in the overall context of inflation, and that’s why I have broadened the scope of this post.

When you see inflation numbers reported in the press – you usually hear about WPI (Wholesale Price Index) and CPI (Consumer Price Index) and then you also hear about core inflation and headline inflation.

In India, WPI is the number that’s widely followed and used to report inflation, and the headline inflation number refers to the WPI inflation number that’s reported every month. For example, you may see the following text in the newspapers: 

India’s headline inflation declined sharply to 6.62 percent in January from 7.18 percent in December – its slowest pace in three years – less than 7.0 percent predicted by the economists polled by Reuters.

The Wholesale Price Index (WPI) declined as the prices of fuel and manufactured items cooled moderately in December, compared to those in the previous month.

Usually, most references are to this number, although there is a contention that CPI is a better index for measuring inflation in India.  We won’t however get into that for the purpose of this post.

The Need for Core Inflation

Headline Inflation or WPI or CPI measures the cost of living in a country and tells us how expensive or cheap living in a country has become over the years and for this reason it has components weighted in more or less the same proportion you would expect to consume them.

The RBI creates monetary policy with a goal to achieve a certain target inflation rate, and the way monetary policy affects inflation is by influencing the aggregate demand in the economy.

Simply put, if RBI thinks the economy is over heated and there is high inflation then they will raise interest rates which will make it harder for people to buy things like cars and homes on a loan and that will lower the overall demand in the economy, and in turn it cool down inflation.

However, demand is not the only factor that causes inflation, there are supply side factors as well, specially factors like food and energy prices that are caused by international factors or temporary supply shocks that cause demand. RBI can’t use the headline inflation number alone to make their decisions because these include supply side factors also which are considered temporary and volatile in nature. Two examples of such supply side shocks are the drought in 2009 and the oil price hike of 2010.

To remove the effects of such factors, RBI and other central banks use another measure of inflation which is called “Core Inflation”. Core inflation only tracks those items that can be influenced by monetary policy, and removes the effect of other items.

In India, the measure for core inflation is WPI excluding primary articles, fuel groups and food items, and this index is called NFMI (Non Food Manufacturing Index). The NFMI consists of components that are 55% of the weight of the WPI and this link does a great job of explaining how to calculate the Non Food Manufacturing Index or India’ Core Inflation measure.

So, in conclusion, the idea behind core inflation is that you get an index that can serve you better in gauging the effect of monetary policy on inflation rates by removing the components that are volatile in nature and  are more prone to price rises due to supply side shocks.

Bad News All Around: All time high Current Account Deficit

RBI released numbers on India’s Balance of Payments for Oct – Dec 2012 today (Read: What is Balance of Payments?) and I think the release is  full of bad news.

The headline grabbing number was the record high CAD (Current Account Deficit) which was 6.7% of GDP for the quarter, and a detailed look at the number shows why this is all bad news.

The CAD is simply the difference between exports and imports, and for India this number was a record high $32.6 billion in the quarter. It rose by 61% when compared with the same quarter a year ago.

The thing that caught my eye the most was that Services Exports declined by 2%, and this is the category that contains Software Services Exports which is an important sector for India. This sector is important not only because of the direct export revenue but also because it sends a large number of Indians abroad who then send money back to India in the form of remittances and that will also get impacted, albeit with a time lag. It is also responsible for creating jobs and absorbs a large number of college graduates.

Merchandise exports didn’t do well either, as there was no growth this quarter where there was a growth of 7.6% in the last quarter. If you consider the April – December 2012 9 month time period, then Merchandise Exports actually declined by 5%.

The CAD was financed by the Capital Account, but the break up of that is not looking too bright either.

FDI declined from $5 billion to$2.5 billion. FII investments increased to $8.6 billion from $1.8 billion, but you can’t take too much solace in that because when FIIs pull their money from the market, it crashes violently leaving everyone invested with a lot of pain.

Additionally, banks availed external loans and borrowed $2.7 billion where they had repaid $8.7 billion in the previous time period. Even Net External commercial borrowings (ECBs) rose to $ 3.1 billion against a net repayment of $0.8 billion in Q3 of 2011-12.

Imports surged on account of oil and gold payments, and that’s not likely to come down in the future any time soon either.

I feel quite pessimistic reading these numbers, and I feel that India is headed towards tough times ahead because of bad economic policy where the rest of the world is showing steady recovery and doing much better than us.

A brief summary of the events in Cyprus

I’ve been fascinated by the events in Cyprus during the last 10 days or so and since I’ve been busier than usual during that time, they are also the only events I’m following.

When I first read about Cyprus’ 6.75% tax on all bank deposits, and 9.75% tax on deposits of more than 100,000 Euros, I was amazed by how they could come up with such a dangerous and stupid idea.

It is very easy to see why this is a dangerous idea by putting yourself in the shoes of a Cypriot and think of what you would do if you woke up one morning and found out that the government has decided to take 6.75% of your money from your bank account!

When you know that your country is a big offshore haven for Russian money, you’re surely going to be doubly angry with this tax because you’re getting screwed at the expense of rich Russians!

You would much rather withdraw your money from the banks and hide it under your mattresses instead of leaving it in the bank, and that would lead to a bank run and be disastrous to the economy. There is simply no escape from that. This is even more so considering the fact that the ECB guarantees deposits of less than 100,000 Euros and such a step shows that this guarantee is meaningless.

Why then would the Cyprus government take such a step?

The Cypriots had only two viable choices to come up with the money – either tax everyone and spread the pain around, or tax only the people who have more than 100,000 Euros in their bank accounts (a lot of them Russians) and protect the small investors.

At first I thought that they chose the first option because of a corrupt government, but that’s not the answer.

The answer is that by imposing huge cuts on big depositors, Cyprus will kill its banking sector. No foreign investor will be interested in depositing their money in Cypriot banks, and since banking is such a big part of the economy, this will be disastrous to the economy and they will see a prolonged recession and unemployment if they took such a step.

But that’s exactly the step they took.

As bad as this option is, it is less worse than complete chaos and unfortunately for them, those are the only two options they were left with.

The one big lesson of this is that the only way to deal with such horrible situations is to never get into one of them. If you get into them, pain is guaranteed.

Cypriot banks will open today after remaining closed for several days and there will be some degree of chaos, but hopefully it won’t be irrecoverably bad, and their economy will be back on its feet in a few years.

Lok Sabha Party Seats in India

The market crashed 288 points today as the DMK withdrew their support for the current UPA government and reminded people how fragile a coalition government can be, and indicated that the government will probably need to spend the time till the next election in managing the coalition and not the economy.

I wanted to see what’s the possibility of the government falling down, and while there were a lot of opinions on what will happen now, I didn’t find an easy way to see which parties hold how many seats in the Lok Sabha, and were currently providing support to UPA.

The best page I saw about which parties held how many seats was the page of the Lok Sabha that has the break up of which party holds how many seats in the Lok Sabha.

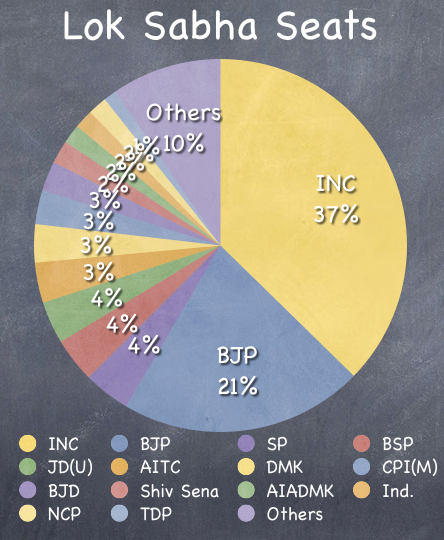
Here is a chart that breaks down this data for the major parties and then I have pasted the full list under that.

Lok Sabha Seats

Full list:

S.No.
Name of Party Member
1 Indian National Congress(INC) 203
2 Bharatiya Janata Party(BJP) 115
3 Samajwadi Party(SP) 22
4 Bahujan Samaj Party(BSP) 21
5 Janata Dal (United) (JD(U)) 20
6 All India Trinamool Congress(AITC) 19
7 Dravida Munnetra Kazhagam(DMK) 18
8 Communist Party of India (Marxist)(CPI(M)) 16
9 Biju Janata Dal(BJD) 14
10 Shiv Sena(SS) 11
11 All India Anna Dravida Munnetra Kazhagam(AIADMK) 9
12 Independent(Ind.) 9
13 Nationalist Congress Party(NCP) 9
14 Telugu Desam Party(TDP) 6
15 Rashtriya Lok Dal(RLD) 5
16 Communist Party of India(CPI) 4
17 Shiromani Akali Dal(SAD) 4
18 Jammu and Kashmir National Conference(J&KNC) 3
19 Janata Dal (Secular)(JD(S)) 3
20 Rashtriya Janata Dal(RJD) 3
21 All India Forward Bloc(AIFB) 2
22 Indian Union Muslim League (IUML) 2
23 Jharkhand Mukti Morcha(JMM) 2
24 Jharkhand Vikas Morcha (Prajatantrik)(JVM (P)) 2
25 Revolutionary Socialist Party(RSP) 2
26 Telangana Rashtra Samithi(TRS) 2
27 Yuvajana Sramika Rythu Congress Party(YSR Congress Party) 2
28 All India Majlis-E-Ittehadul Muslimeen(AIMIM) 1
29 All India United Democratic Front(AIUDF) 1
30 Asom Gana Parishad(AGP) 1
31 Bahujan Vikas Aaghadi(BVA) 1
32 Bodoland Peoples Front(BPF) 1
33 Haryana Janhit Congress (BL) (HJC) 1
34 Kerala Congress (M) (KC(M)) 1
35 Marumalarchi Dravida Munnetra Kazhagam(MDMK) 1
36 Nagaland Peoples Front(NPF) 1
37 Sikkim Democratic Front(SDF) 1
38 Swabhimani Paksha(SWP) 1
39 Viduthalai Chiruthaigal Katchi(VCK) 1

The DMK with its 18 members is one of the bigger partners of the UPA and it was useful for me to look at this data in this manner. I have long felt that the biggest threat to the Indian economy’s growth is the political uncertainty and inefficiencies that exist and events such as todays further reinforces that.

What is the Sensex high adjusted for inflation?

The Dow hit a new record high of 14,253.77 today and at least I was very surprised by this new record. There were a couple of things that caught my eye while browsing through stories about this high, and I was curious to see how they were applicable in an Indian context.

The first one was simply that the Dow has more than doubled from its 2009 low, and the last 4 years have been a great bull market. I’m not sure how I feel about that. It is factually correct, but if you recall the terrible sentiment that existed in the last four years, I don’t know that you would have known you are in a bull market from that.

But does it hold true in an Indian context as well? Has the Sensex more than doubled in the last four years?

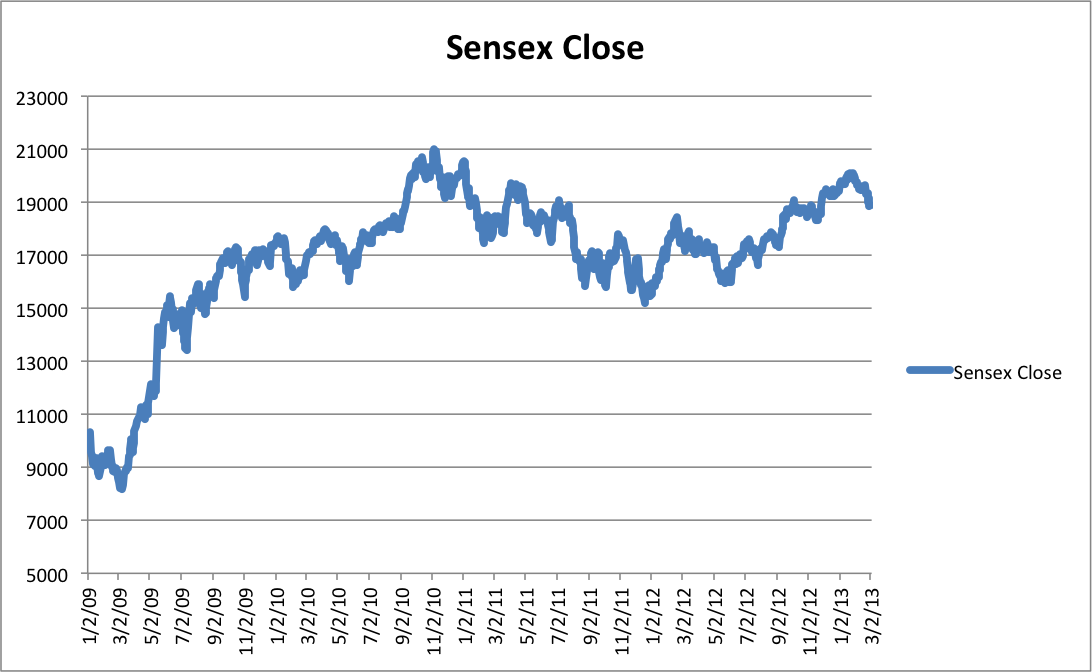
A chart is in order. This is the Sensex close from Jan 2009 till yesterday.

Sensex Jan 2009 Mar 5 2013

The lowest point on this chart is 8,160.4 on September 3 2009. So, yes, the Sensex has more than doubled in the last 4 years. But the more important question is – have you taken advantage of this move?

Sensex High Adjusted for Inflation

The second thing that I saw at a few places today was that sure the Dow has hit a high, but it hasn’t been able to beat inflation. This made me wonder what the Sensex high would be if it were adjusted for inflation?

The all time Sensex closing high is 21,004 on November 5 2010.To adjust this for inflation, I went to the website of Labour Bureau of India.

They have historical CPI inflation data there, and I was able to look at the number for November 2010, and January 2013 (latest month for which number is available) and adjust the Sensex high for inflation.

The CPI index for November 2010 was 182, and the number for January 2013 was 221. So you can derive the Sensex high adjusted for inflation as (221/182) x 21004.

This comes out to be 25,505.

So based on this crude method, I’d say that Sensex high adjusted for inflation should be 25,505 and we shouldn’t be rejoicing till the Sensex blows past this number, but then given the current situation, it would be good to just see a new nominal high.

2013 Budget – Where does the government spend your money?

Yesterday I detailed out the sources of funds for the government and in today’s post I’ll show a break up of how the government spends your money.

There are two heads of government spending – Non Plan Expenditure and Plan Expenditure. Non Plan Expenditure is money that’s spent on sustaining the country like defense, postal deficit, subsidies etc. and Plan Expenditure is the money that is spent on improving the country like the money spent on dams, roads etc.

As you would probably expect, a lot more is spent on sustaining the country than is spent on improving it.

Plan versus Non Plan Expenditure

First, let’s take a look at the break up between the Plan and Non Plan Expenditure.

Head In Crore of Rupees
Plan Expenditure 5,55,322.00
Non Plan Expenditure 11,09,975.32
Grand Total 16,65,297.32

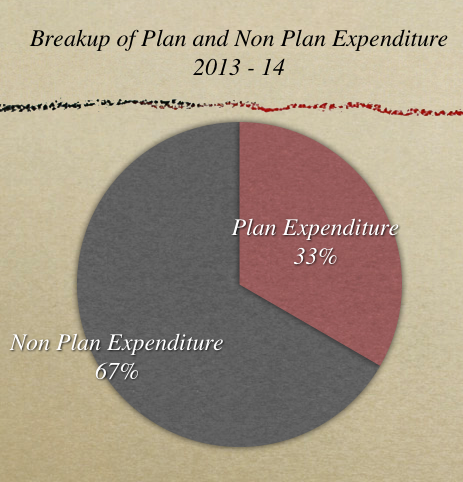
Here is a pie chart that shows how this breaks out.

Plan and Non Plan Expenditure

Non Plan Expenditure

Now let’s take a look at the break up of the non major expenditure items.


Head In Crore of Rupees
Interest Payment and Debt Servicing 3,70,684
Defence Services expenditure 2,03,672
Capital Outlay (excluding Defence) 30,131
Grants to State Governments 76,105
Pensions 70,726
Food Subsidy 90,000
Police 40,895
Grants to Foreign Governments 4,144
Transport 3,541
Petroleum subsidy 65,000
Other Non Plan expenditure 155,077
Grand Total 11,09,975

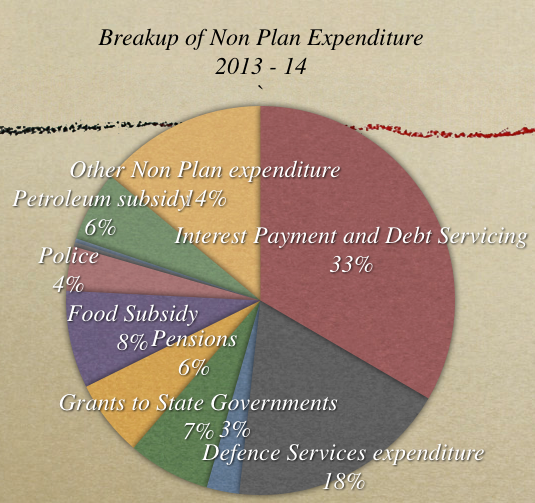
Here is a pie chart that shows the breakup of these numbers.

Breakup of Non Plan Expenditure 2013 - 14

For those who are not familiar with this, the biggest surprise will be how much we spend on interest payments, and the as you saw yesterday, the borrowing keeps rising and so the interest payment will have to go up as well.

Subsidies are another interesting item because it shows the strain on government finances, and even if you get something for less than the market price, ultimately you will have to pay for it.

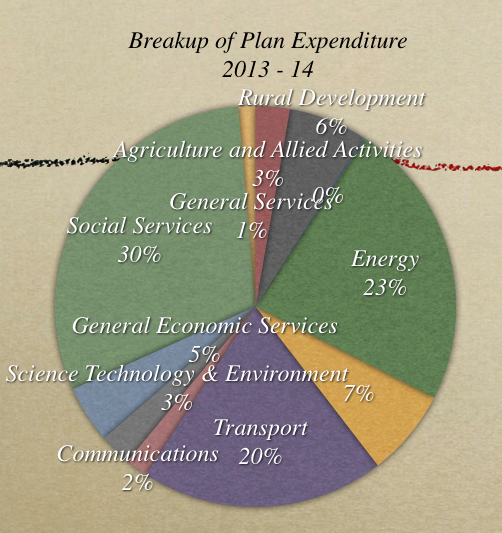
Plan Expenditure

Now, let’s take a look at the major heads of Plan Expenditure.

Agriculture and Allied Activities 18781.28
Rural Development 42772.55
Irrigation and Flood Control 1200.00
Energy 158286.92
Industry and Minerals 48009.82
Transport 133488.05
Communications 12379.92
Science Technology & Environment 17586.79
General Economic Services 31602.43
Social Services 206708.92
General Services 9306.71
GRAND TOTAL 680123.39

Here is a pie chart that shows the breakup of all these expenses.

Breakup of Plan Expenditure

Budget 2013 – Where does the government get its revenue from?

I have already written about some of the key features of the budget, and now let’s take a look at how the government gets its revenues. There are three sources from where the government gets money. The first two are revenue sources, and the last one is borrowings and capital asset sales.

These are listed here:

1. Revenue Receipts – Tax Revenue: This is the tax that the government collects in the form of corporation tax, personal income tax, customs, excise etc.

2. Non Tax Revenue: These are things like interests on bonds held, dividends from PSUs, and grants. They are revenue sources meaning they don’t have to be repaid and are smaller than tax revenues.

3. Capital Receipts: These are borrowings of the government like the market loans, short term borrowings, external commercial receipts etc.

Now, some charts and the source for the data is the budget website.

Breakup of Government Revenues

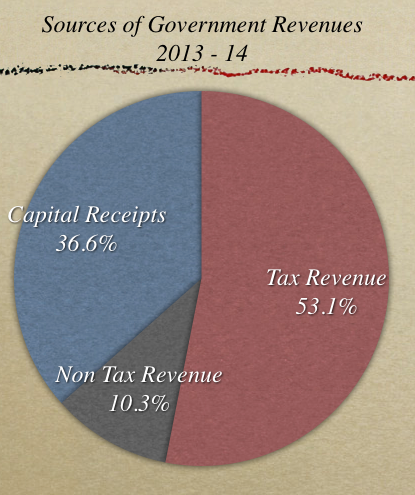
First, let’s take a look at how these three sources contribute to the government’s kitty.

Head In Crore of Rupees
Tax Revenue 8,84,078.32
Non Tax Revenue 1,72,252.38
Capital Receipts 6,08,966.62
Grand Total 16,65,297.32

Here is a pie chart that shows the relative contribution of these three sources.

Sources of Government Revenues 2013 - 14

From the chart above you can see that tax revenues form the biggest chunk of government receipts. What’s also interesting is that Capital Receipts form 37% of the receipts. This is quite high because most of this is in the form of borrowings, and if this was the budget of a family they would be in trouble since they have to finance 37% of their expenses by borrowing money.

What’s amazing about this break up is that it is identical to the budget last year. Click here to look at that chart. 

Breakup of Tax Revenues

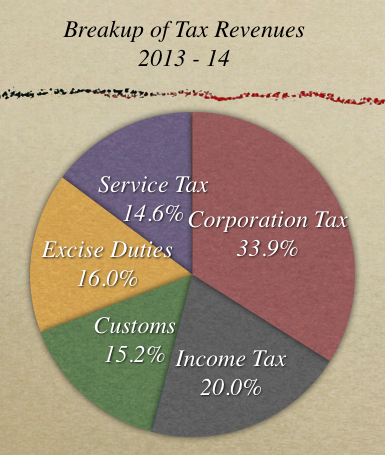
Tax revenues are the biggest sources of government funds, and now let’s take a look at what constitutes our tax revenues.

Head In Crore of Rupees
Corporation Tax  4,19,520.00
Income Tax  2,47,639.00
Wealth Tax  950.00
Customs  1,87,308.00
Excise Duties  1,97,553.95
Service Tax  1,80,141.00
Taxes on UT  2,758.13
Grand Total  12,35,870.08

The grand total here is a lot bigger than the tax revenue grand total in the first table because the first table has the tax revenues reduced by the state’s share of it.

Here is a chart that shows the percentage contribution of these various sources, and for people not familiar with this breakup – the biggest surprise for them will be that Corporate Taxes contribute a lot more to the kitty than the personal income tax. If you compare this with last year’s number you will see that the the contribution of income tax has gone up 2 points in the overall pie.

Breakup of Tax Revenues 2013 - 14

Non Tax Revenues

Non tax revenues are not nearly as big as tax revenues and a lot of them come from PSU dividends and then some come from petroleum royalties that are covered in the Economic Services section below.

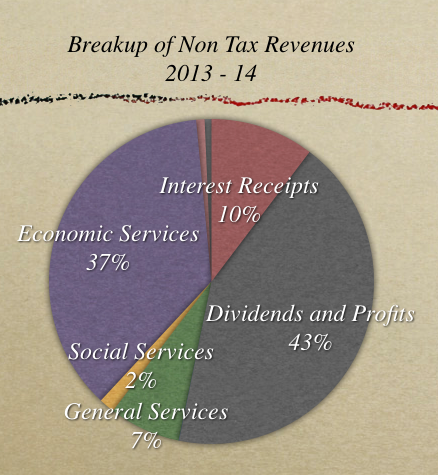
Here is the break up of non tax revenues.

Head In Crore of Rupees
Interest Receipts 17,764.39
Dividends and Profits 73,866.36
Fiscal Services 87.82
General Services 12,254.71
Social Services 2,684.42
Economic Services 62,972.64
Grants 1456.13
Non Tax Rev of UT 1165.91
Grand Total 172252.38

Here is how the various heads look like in a pie chart.

Non Tax Revenues 2013 - 14

The one thing that I always think about when I look at this number is the fact that India is slowly divesting PSUs and eventually these dividends and profits are going to go down. The other related thing is that the divestment money is being used to plug the gap between revenues and expenses, but divestment will not be a continual source of income like taxes.

Now, let’s move to the third source of income which is capital receipts.

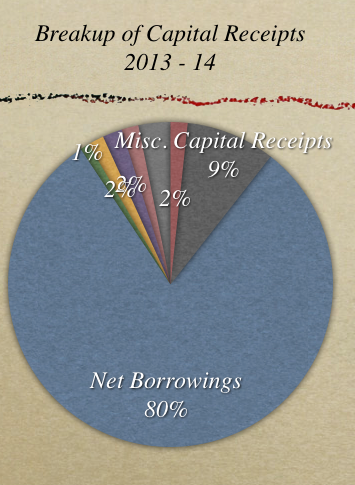
Capital Receipts

As you can see the government has to rely a lot on Capital Receipts, and Capital Receipts are mainly just borrowings. The other big number there is disinvestments which comes under miscellaneous capital receipts and is Rs. 40,000 crores for this fiscal.

Here is how they break out.

Head In Crore of Rupees
Recoveries of Loans & Advances 10,654.00
Misc. Capital Receipts 55,814.00
Net Borrowings 503,844.46
Net Securities against Small Savings 5,797.52
State PF Net 10,000
Other Receipts 12,296.54
External Debt 10,560.10
Net Market Stabilisation Scheme 20,000.00
Grand Total 628,966.62

You will notice that this is Rs. 20,000 crores more than the capital receipts shown in the first table, and so far I haven’t been able to find out the reason for the difference. The number in the first table equals allows the total to add to the expenses and also the Reconciliation Statement on the budget website lists down the capital receipts as 608,966.62 crores so that number is the right Net Capital Receipts but I don’t know from which head the 20,000 crores has to be removed in the latter table.

Here is a pie chart of the above numbers.

Capital Receipts 2013 - 14

Conclusion

We have been talking about deficit for some time here, and if you look at these numbers above – 36.6% of the total revenues are capital receipts, and 80% of those capital receipts are borrowings. So, effectively we borrow 29.3% of what we have to spend. That’s just too high, and has to be brought under control. When you look at it from this context, widening the tax base and better compliance is inevitable if you have to get this number under control.