The New India Assurance Company IPO Review

This post is written by Shiv Kukreja, who is a Certified Financial Planner and runs a financial planning firm, Ojas Capital in Delhi/NCR. He can be reached at skukreja@investitude.co.in

New India Assurance IPO Details

Should you invest in New India Assurance IPO or not @ Rs. 770-800?

picture2

During the financial year 2016-17, New India Assurance reported Gross Written Premium of Rs. 23,230 crore, up 20.82% against previous year’s Rs. 19,227 crore. However, Gross Written Premium is the only area in which the company registered some kind of growth, as the company failed to perform on all other parameters. The company reported an operating loss of Rs. 901.37 crore as against Rs. 533.43 crore loss it had in FY 2015-16. Its profit after tax (PAT) was also down 9.72% at Rs. 839.86 crore as against Rs. 930.35 crore in 2015-16.

Combined Ratio stood at 119.73% (vs. 117.97% in FY 2015-16) and Solvency Ratio was at 2.22 times (vs. 2.46 times in FY 2015-16). Combined Ratio of 100 or above indicates that the company is incurring losses in its core insurance business. As far as Return on Net Worth (RoNW) is concerned, it has fallen from a high of 12.32% in FY 2014-15 to almost half at 6.81%.

Recently listed ICICI Lombard is the only listed company with which we can compare NIA’s pricing and valuations, and NIA lags ICICI Lombard in almost all the parameters except Solvency Ratio. Firstly, NIA’s market share has declined from 15.6% in FY 2014-15 to 15% in FY 2016-17, whereas ICICI Lombard has been able to increase its pie from 7.9% in FY 2014-15 to 8.4% in FY 2016-17. HDFC Ergo and IFFCO Tokio too have gained on their respective market shares. Moreover, ICICI Lombard reported far better Combined Ratio (104%), Loss Ratio (80.4%) and Expense Ratio (23.6%) as compared to NIA for which these ratios stood at 118.7%, 91.3% and 27.4% respectively during the same period.

Peer Comparison

picture3

As far as its pricing is concerned, NIA is seeking a valuation of 74.63 times its trailing EPS of Rs. 10.72 and 4.88 times its book value of Rs. 164.04 as on June 30, 2017. The company showed a surprisingly remarkable turnaround in the first quarter of the current financial year and reported an EPS of Rs. 6.29 a share, based on which the PE ratio it is seeking has fallen to 31.8 times its annualised EPS of Rs. 25.16. However, looking at its declining or inconsistent performance in the past, I have a serious doubt over sustainability of this turnaround and that is why I don’t think the company deserves such high valuations. At these high valuations, I would personally avoid this IPO and invest my money with better managements and bankable businesses.

New India Assurance IPO Details & Review – Should You Invest or Not @ Rs. 770-800?

This post is written by Shiv Kukreja, who is a Certified Financial Planner and runs a financial planning firm, Ojas Capital in Delhi/NCR. He can be reached at skukreja@investitude.co.in

After divesting its stake in GIC Re, the government has placed its stake on sale in its 99.99% subsidiary, The New India Assurance Company Limited, through its initial public offer (IPO) of Rs. 675 crore. The issue is getting opened for subscription from today, November 1 and will remain open for three days to close on November 3. The IPO is a mix of fresh issue of 2.40 crore shares by the company and an offer for sale (OFS) of 9.60 crore equity shares by the Government of India.

The company has fixed its price band in the range of Rs. 770-800 a share and a discount of Rs. 30 a share will be given to the retail investors and eligible employees of the company. The offer would constitute 14.56% of the company’s post-offer paid-up equity share capital.

Here are some of the salient features of this issue:

Size of the Issue – This IPO is a combination of an offer for sale (OFS) of 9.60 crore shares by the Government of India and a fresh issue of 2.40 crore shares, which makes it a Rs. 9,467 crore IPO at the upper end of the price band of Rs. 800.

Price Band – New India Assurance has fixed its IPO price band to be between Rs. 770-800 a share and the company has decided to offer a discount of Rs. 30 a share to the retail investors, as well as its eligible employees.

Retail Allocation – 35% of the issue has been reserved for the retail individual investors (RIIs), 15% for the non-institutional investors (NIIs) and the remaining 50% shares will be allocated to the qualified institutional buyers (QIBs).

Rs. 30 a share discount for Retail Investors & Employees – The company has decided to offer a discount of Rs. 30 a share to the retail individual investors and its eligible employees.

Reservation for Employees – The company has decided to keep 36 lakh shares worth Rs. 277.20 crore reserved exclusively for its employees.

Bid Lot Size & Minimum Investment – Investors need to bid for a minimum of 18 shares in this offer and in multiples of 18 shares thereafter. So, a retail investor would be required to invest a minimum of Rs. 13,860 at the upper end of the price band and Rs. 13,320 at the lower end of the price band.

Maximum Investment – Individual investors investing up to Rs. 2 lakh are categorised as retail individual investors (RIIs). As a retail investor, you can apply for a maximum of 14 lots of 18 shares each @ Rs. 770 a share i.e. a maximum investment of Rs. 1,94,040. At Rs. 740 a share, you can apply for a maximum of 15 lots of 18 shares, thus making it Rs. 1,99,800.

Listing – The shares of the company will get listed on both the stock exchanges i.e. National Stock Exchange (NSE) and Bombay Stock Exchange (BSE) within 6 working days after the issue gets closed on November 3rd. Its shares are expected to get listed on November 13th.

Here are some other important dates as the issue gets closed on November 3:

Finalisation of Basis of Allotment – On or about November 8, 2017

Initiation of Refunds – On or about November 9, 2017

Credit of equity shares to investors’ demat accounts – On or about November 10, 2017

Commencement of Trading on the NSE/BSE – On or about November 13, 2017

Financials of The New India Assurance Company Limited

picture2

(Note: Figures are in Rs. Crore, except per share data & percentage figures)

Should you invest in New India Assurance IPO or not @ Rs. 770-800?

During the financial year 2016-17, New India Assurance reported Gross Written Premium of Rs. 23,230 crore, up 20.82% against previous year’s Rs. 19,227 crore. However, Gross Written Premium is the only area in which the company registered some kind of growth, as the company failed to perform on all other parameters. The company reported an operating loss of Rs. 901.37 crore as against Rs. 533.43 crore loss it had in FY 2015-16. Its profit after tax (PAT) was also down 9.72% at Rs. 839.86 crore as against Rs. 930.35 crore in 2015-16.

Combined Ratio stood at 119.73% (vs. 117.97% in FY 2015-16) and Solvency Ratio was at 2.22 times (vs. 2.46 times in FY 2015-16). Combined Ratio of 100 or above indicates that the company is incurring losses in its core insurance business. As far as Return on Net Worth (RoNW) is concerned, it has fallen from a high of 12.32% in FY 2014-15 to almost half at 6.81%.

Recently listed ICICI Lombard is the only listed company with which we can compare NIA’s pricing and valuations, and NIA lags ICICI Lombard in almost all the parameters except Solvency Ratio. Firstly, NIA’s market share has declined from 15.6% in FY 2014-15 to 15% in FY 2016-17, whereas ICICI Lombard has been able to increase its pie from 7.9% in FY 2014-15 to 8.4% in FY 2016-17. HDFC Ergo and IFFCO Tokio too have gained on their respective market shares. Moreover, ICICI Lombard reported far better Combined Ratio (104%), Loss Ratio (80.4%) and Expense Ratio (23.6%) as compared to NIA for which these ratios stood at 118.7%, 91.3% and 27.4% respectively during the same period.

picture3

As far as its pricing is concerned, NIA is seeking a valuation of 74.63 times its trailing EPS of Rs. 10.72 and 4.88 times its book value of Rs. 164.04 as on June 30, 2017. The company showed a surprisingly remarkable turnaround in the first quarter of the current financial year and reported an EPS of Rs. 6.29 a share, based on which the PE ratio it is seeking has fallen to 31.8 times its annualised EPS of Rs. 25.16. However, looking at its declining or inconsistent performance in the past, I have a serious doubt over sustainability of this turnaround and that is why I don’t think the company deserves such high valuations. At these high valuations, I would personally avoid this IPO and invest my money with better managements and bankable businesses.

Mahindra Logistics IPO Details & Review – Should You Invest or Not @ Rs. 425-429?

This post is written by Shiv Kukreja, who is a Certified Financial Planner and runs a financial planning firm, Ojas Capital in Delhi/NCR. He can be reached at skukreja@investitude.co.in

Mahindra Logistics is entering the primary markets with its initial public offer (IPO) of Rs. 675 crore. The issue is getting opened for subscription from today, October 31 and will remain open for three days to close on November 2. This IPO is a 100% offer for sale (OFS) and hence, the company will not get any money out of this IPO for its further expansion.

The company has fixed its price band in the range of Rs. 425-429 a share and no discount has been offered to the retail investors. The offer would constitute 27.17% of the company’s post-offer paid-up equity share capital.

Here are some of the salient features of this issue:

Size of the Issue – As mentioned above as well, this IPO is in the form of an offer for sale (OFS) of 1.93 crore shares, out of which 96.66 lakh shares have been offered by the promoter Mahindra & Mahindra Limited (M&M), 92.71 lakh shares by its shareholders Normandy Holdings Limited and 3.95 shares by Kedaara Capital AIF 1. This makes it a Rs. 675 crore IPO at the upper end of the price band i.e. Rs. 429.

Price Band – Mahindra Logistics has fixed its IPO price band to be between Rs. 425-429 a share and the company has decided not to offer any discount to the retail investors.

Retail Allocation – 35% of the issue has been reserved for the retail individual investors (RIIs), 15% for the non-institutional investors (NIIs) and the remaining 50% shares will be allocated to the qualified institutional buyers (QIBs).

No discount for Retail Investors – The company has decided not to offer any discount to the retail investors. But, a discount of Rs. 42 a share will be offered to the employees of the company.

Bid Lot Size & Minimum Investment – Investors need to bid for a minimum of 34 shares in this offer and in multiples of 34 shares thereafter. So, a retail investor would be required to invest a minimum of Rs. 14,586 at the upper end of the price band and Rs. 14,450 at the lower end of the price band.

Maximum Investment – Individual investors investing up to Rs. 2 lakh are categorised as retail individual investors (RIIs). As a retail investor, you can apply for a maximum of 13 lots of 34 shares each @ Rs. 429 a share i.e. a maximum investment of Rs. 1,89,618. At Rs. 425 per share, you can apply for a maximum of 13 lots of 34 shares, thus making it Rs. 1,87,850.

Listing – The shares of the company will get listed on both the stock exchanges i.e. National Stock Exchange (NSE) and Bombay Stock Exchange (BSE) within 6 working days after the issue gets closed on November 2nd. Its shares are expected to get listed on November 10th.

Here are some other important dates as the issue gets closed on November 2:

Finalisation of Basis of Allotment – On or about November 8, 2017

Initiation of Refunds – On or about November 9, 2017

Credit of equity shares to investors’ demat accounts – On or about November 9, 2017

Commencement of Trading on the NSE/BSE – On or about November 10, 2017

Financials of Mahindra Logistics

picture1

(Note: Figures are in Rs. Crore, except per share data & percentage figures)

Should you invest in Mahindra Logistics IPO or Not @ Rs. 429?

During the financial year 2016-17, Mahindra Logistics reported total revenues of Rs. 2,676.25 crore and profit after tax (PAT) of Rs. 46.07 crore as against Rs. 2,077.13 crore and Rs. 35.97 crore in the previous financial year, thereby generating a net profit margin of 1.72% in 2016-17 vs. 1.73% in the previous year. At Rs. 429 a share, the company is valued at 64.80 times its reported diluted EPS of Rs. 6.62 for the financial year 2016-17 and 50.12 times its annualised diluted EPS of Rs. 8.56.

The company is running its business with some wafer thin profit margins and they have been on a declining trend since FY 2013-14. During FY 2013-14, it reported profit margins of 2.08%, which have fallen to 1.72% in FY 2016-17. The company reported 29.45% as return on net worth (RoNW) during FY 2013-14, which has fallen to 13.11% in the previous year. Despite operating in such low margins business, I think seeking a multiple of 50+ times is not justified. I think it is the market euphoria which is making these companies price their issues on a higher valuations than what they deserve.

The valuations Mahindra Logistics is seeking are on a higher side for me to invest in this IPO. But, given its unique business model, there is a huge scope for the company to improve on its profitability and margins. I’ll wait for the company to report healthier financials going forward before investing my money for it to grow further. Till then, I’ll just wait and watch.

Reliance AMC IPO Review – Should You Invest or Not @ Rs. 247-252?

This post is written by Shiv Kukreja, who is a Certified Financial Planner and runs a financial planning firm, Ojas Capital in Delhi/NCR. He can be reached at skukreja@investitude.co.in

Reliance Nippon Life Asset Management Limited (Reliance AMC) is all set to enter the primary markets with its initial public offer (IPO) of Rs. 1,542 crore. The issue is getting opened for subscription from Wednesday, October 25 and will remain open for three days to close on October 27. This IPO is a mix of fresh issue of about 2.45 crore equity shares by the company and an offer for sale (OFS) of around 3.67 crore equity shares by the promoters.

The company has fixed its price band in the range of Rs. 247-252 a share and no discount has been offered to the retail investors. The offer would constitute 10% of the company’s post-offer paid-up equity share capital.

Here are some of the salient features of this issue:

Size of the Issue – This IPO is a combination of an offer for sale (OFS) of 3.67 crore shares by the promoters, Reliance ADAG and Nippon Life Asset Management Limited and a fresh issue of 2.45 crore shares by the company. This makes it a Rs. 1,542 crore IPO at the upper end of the price band i.e. Rs. 252.

Price Band – Reliance AMC has fixed its IPO price band to be between Rs. 247-252 a share and the company has decided not to offer any discount to the retail investors.

Retail Allocation – 35% of the issue has been reserved for the retail individual investors (RIIs), 15% for the non-institutional investors (NIIs) and the remaining 50% shares will be allocated to the qualified institutional buyers (QIBs).

No discount for Retail Investors or Employees – The company has decided not to offer any discount to any of its investors or to its employees either.

Bid Lot Size & Minimum Investment – Investors need to bid for a minimum of 59 shares in this offer and in multiples of 59 shares thereafter. So, a retail investor would be required to invest a minimum of Rs. 14,868 at the upper end of the price band and Rs. 14,573 at the lower end of the price band.

Maximum Investment – Individual investors investing up to Rs. 2 lakh are categorised as retail individual investors (RIIs). As a retail investor, you can apply for a maximum of 13 lots of 59 shares each @ Rs. 252 a share i.e. a maximum investment of Rs. 1,93,284. At Rs. 247 per share, you can apply for a maximum of 13 lots of 59 shares, thus making it Rs. 1,89,449.

Listing – The shares of the company will get listed on both the stock exchanges i.e. National Stock Exchange (NSE) and Bombay Stock Exchange (BSE) within 6 working days after the issue gets closed on October 27th. Its shares are expected to get listed on November 6th.

Here are some other important dates as the issue gets closed on October 27:

Finalisation of Basis of Allotment – On or about November 1, 2017

Initiation of Refunds – On or about November 3, 2017

Credit of equity shares to investors’ demat accounts – On or about November 3, 2017

Commencement of Trading on the NSE/BSE – On or about November 6, 2017

Financials of Reliance Nippon Life AMC

picture1

(Note: Figures are in Rs. Crore, except per share data & percentage figures)

Should you invest in Reliance AMC IPO or Not @ Rs. 252?

Like most of the IPOs that have hit the streets in the last six months or so, this IPO too seems to seek a high premium for its shares on offer. At Rs. 252 a share, the company is valued at 36.79 times its FY17 earnings and 8.97 times based on its book value as on June 30, 2017. For a company which is facing a tough competition from the existing as well as new entrants in the asset management business and seeing a consistent decline in its financial health, these valuations are not attractive for either listing gains, or for long term wealth creation.

The company reported profit after tax (PAT) of Rs. 402.76 crore during FY17, as against Rs. 396.43 crore in FY16 and Rs. 354.46 crore in FY15. This translates into a growth of just 1.6% in the last year’s profits and 6.6% CAGR in the last two years’ profits. This growth is not upto the mark if you consider this 2-year period to be a bumper one for the growth in the AUMs of the mutual fund industry as a whole.

Despite of the fact that Reliance AMC is one of the better companies in the ADAG group of companies, I think the company is seeking valuations way higher than what it deserves for the kind of growth it has been able to deliver. Personally I would avoid this IPO at these valuations and wait for it to correct to reasonably attractive valuations before making an entry into it.

GIC IPO Review – Should You Invest or Not @ Rs. 855-912?

This post is written by Shiv Kukreja, who is a Certified Financial Planner and runs a financial planning firm, Ojas Capital in Delhi/NCR. He can be reached at skukreja@investitude.co.in

 General Insurance Corporation of India (GIC Re) IPO Details

Financials of GIC Re

picture2

(Note: Figures are in Rs. Crore, except per share data & percentage figures)

Combined Ratio – This is the measure of profitability which is used to indicate how well underwriting operations are performing. The combined ratio is calculated by taking a percentage of claims incurred (net) divided by premiums earned (net) plus percentage of expenses of management and net commission and then dividing the quotient by net premium. A ratio below 100% indicates that the company is making underwriting income/profits, while a ratio above 100% means that the company is paying out more money than it is receiving from premiums.

Solvency Ratio – This is a regulatory measure of capital adequacy, calculated by dividing available solvency margin by required solvency margin, each as calculated in accordance with the guidelines of the IRDAI on a standalone restated basis. The IRDAI has set a minimum solvency ratio of 1.50.

Should You Invest or Not in GIC IPO?

During financial year 2016-17, GIC reported an operating income of Rs. 2,142 crore, investment income of Rs. 1,638 crore and profit after tax (PAT) of Rs. 3,141 crore, as against Rs. 1,590 crore, Rs. 1,436 crore and 2,823 crore respectively in the previous financial year, registering a growth of 34.72%, 14.07% and 11.26% respectively. The company could manage to deliver such a big jump of 34.72% in its operating income last year, all thanks to an unusually high jump in its gross premium last year, which in turn was the result of the launch of Pradhan Mantri Crop Insurance Scheme.

Is such a high growth sustainable? It doesn’t seem so, as the company has reported a muted set of numbers in the first quarter of the current financial year and the recent slowdown in the Indian economy would make it even tougher for the company to avoid a degrowth in its operating revenues and profitability in the current financial year.

The company reported an EPS of Rs. 36.52 a share as on March 31, 2017 and a net worth of Rs. 234.22 a share as on June 30, 2017, which gives it a multiple of 24.97 times its EPS and 3.89 times its book value. These multiples seem reasonably fair to me as per the current market sentiment. Moreover, recently listed insurance companies, SBI Life, ICICI Lombard and ICICI Prudential, all are trading at multiples higher than that of GIC, but then they are growing at a faster pace as compared to GIC and their growth is relatively consistent as well. So, the premium with which other listed insurance companies are trading relative to GIC seem justified to me.

There are other financials parameters also, which again make it difficult to take a final call to invest in it or not. The company has shown a consistent improvement in its combined ratio, from 108.86% in FY 2014-15 to 98.43% in Q1 of FY 2017-18. However, Solvency Ratio and Return on Net Worth (RoNW) have been on a declining trend during this period, from a high of 3.32 times to 1.83 times as far as Solvency Ratio is concerned, and from 18.97% during FY 2014-15 to 16.09% in FY 2016-17 and 3.12% in Q1 of FY 2017-18.

Finally, investing in this IPO depends on two things – one, what kind of investor you are and two, what is your investment objective with this IPO. I mean if you usually invest in IPOs for making quick listing gains and exit out immediately post listing, then I think this IPO is not for you. I think even in a buoyant market sentiment as it is there in the markets these days, I don’t think GIC should have listing gains of more than 8-10% in this IPO. I think GIC is fairly valued in this price band of Rs. 855-912 and it should consolidate here in the price range of Rs. 800-1000 in the short-term, and should break out of this range only when the company shows some real improvement in its core operating income and profitability.

I think Rs. 45 a share discount is key here and provides a much required margin of safety for the retail investors. Probably in its absence, I would have definitely avoided this IPO. But, its presence has put me in two minds. Still I would skip this IPO and wait for better opportunities to invest in GIC post listing, or pick better companies relatively.

General Insurance Corporation of India (GIC Re) IPO Details

This post is written by Shiv Kukreja, who is a Certified Financial Planner and runs a financial planning firm, Ojas Capital in Delhi/NCR. He can be reached at skukreja@investitude.co.in

GIC IPO Review – Should You Invest or Not @ Rs. 855-912?

General Insurance Corporation of India (GIC Re), 99.99% subsidiary of the Government of India and India’s largest re-insurance company, is all set to enter the primary markets with its initial public offer (IPO) of Rs. 11,176 crore. The issue is getting opened for subscription today and will remain open for three days to close on October 13. This IPO is a mix of fresh issue of 1.72 crore equity shares by the company and an offer for sale (OFS) of 10.75 crore equity shares by the Government of India.

The company has fixed its price band in the range of Rs. 855-912 a share and in order to attract the retail investors, Rs. 45 a share discount has been offered by the company. The offer would constitute 14.22% of the company’s post-offer paid-up equity share capital.

Here are some of the salient features of this issue:

Size of the Issue – This IPO is a combination of an offer for sale (OFS) of 10.75 crore shares by the Government of India and a fresh issue of 1.72 crore shares. This makes it a Rs. 11,176 crore IPO at the upper end of the price band of Rs. 912.

Price Band – GIC Re has fixed its IPO price band to be between Rs. 855-912 a share and the company has decided to offer a discount of Rs. 45 a share to the retail investors and its eligible employees.

Retail Allocation – 35% of the issue has been reserved for the retail individual investors (RIIs), 15% for the non-institutional investors (NIIs) and the remaining 50% shares will be allocated to the qualified institutional buyers (QIBs).

Rs. 45 a share discount for Retail Investors & Employees – The company has decided to offer a discount of Rs. 45 a share to the retail individual investors and its eligible employees.

Reservation for Employees – The company has decided to keep its shares worth Rs. 11.68 crore reserved exclusively for its employees.

Bid Lot Size & Minimum Investment – Investors need to bid for a minimum of 16 shares in this offer and in multiples of 16 shares thereafter. So, a retail investor would be required to invest a minimum of Rs. 13,872 at the upper end of the price band and Rs. 12,960 at the lower end of the price band.

Maximum Investment – Individual investors investing up to Rs. 2 lakh are categorised as retail individual investors (RIIs). As a retail investor, you can apply for a maximum of 14 lots of 16 shares each @ Rs. 867 a share i.e. a maximum investment of Rs. 1,94,208. At Rs. 810 per share, you can apply for a maximum of 15 lots of 16 shares, thus making it Rs. 1,94,400.

Listing – The shares of the company will get listed on both the stock exchanges i.e. National Stock Exchange (NSE) and Bombay Stock Exchange (BSE) within 6 working days after the issue gets closed on October 13th. Its shares are expected to get listed on October 25th.

Here are some other important dates as the issue gets closed on October 13:

Finalisation of Basis of Allotment – On or about October 18, 2017

Initiation of Refunds – On or about October 23, 2017

Credit of equity shares to investors’ demat accounts – On or about October 24, 2017

Commencement of Trading on the NSE/BSE – On or about October 25, 2017

Financials of GIC Re

picture2

(Note: Figures are in Rs. Crore, except per share data & percentage figures)

During financial year 2016-17, GIC reported an operating income of Rs. 2,142 crore, investment income of Rs. 1,638 crore and profit after tax (PAT) of Rs. 3,141 crore, as against Rs. 1,590 crore, Rs. 1,436 crore and 2,823 crore respectively in the previous financial year, registering a growth of 34.72%, 14.07% and 11.26% respectively. The company could manage to deliver such a big jump of 34.72% in its operating income last year, all thanks to an unusually high jump in its gross premium last year, which in turn was the result of the launch of Pradhan Mantri Crop Insurance Scheme.

Is such a high growth sustainable? It doesn’t seem so, as the company has reported a muted set of numbers in the first quarter of the current financial year and the recent slowdown in the Indian economy would make it even tougher for the company to avoid a degrowth in its operating revenues and profitability in the current financial year.

The company reported an EPS of Rs. 36.52 a share as on March 31, 2017 and a net worth of Rs. 234.22 a share as on June 30, 2017, which gives it a multiple of 24.97 times its EPS and 3.89 times its book value. These multiples seem reasonably fair to me as per the current market sentiment. Moreover, recently listed insurance companies, SBI Life, ICICI Lombard and ICICI Prudential, all are trading at multiples higher than that of GIC, but then they are growing at a faster pace as compared to GIC and their growth is relatively consistent as well. So, the premium with which other listed insurance companies are trading relative to GIC seem justified to me.

There are other financials parameters also, which again make it difficult to take a final call to invest in it or not. The company has shown a consistent improvement in its combined ratio, from 108.86% in FY 2014-15 to 98.43% in Q1 of FY 2017-18. However, Solvency Ratio and Return on Net Worth (RoNW) have been on a declining trend during this period, from a high of 3.32 times to 1.83 times as far as Solvency Ratio is concerned, and from 18.97% during FY 2014-15 to 16.09% in FY 2016-17 and 3.12% in Q1 of FY 2017-18.

Finally, investing in this IPO depends on two things – one, what kind of investor you are and two, what is your investment objective with this IPO. I mean if you usually invest in IPOs for making quick listing gains and exit out immediately post listing, then I think this IPO is not for you. I think even in a buoyant market sentiment as it is there in the markets these days, I don’t think GIC should have listing gains of more than 8-10% in this IPO. I think GIC is fairly valued in this price band of Rs. 855-912 and it should consolidate here in the price range of Rs. 800-1000 in the short-term, and should break out of this range only when the company shows some real improvement in its core operating income and profitability.

I think Rs. 45 a share discount is key here and provides a much required margin of safety for the retail investors. Probably in its absence, I would have definitely avoided this IPO. But, its presence has put me in two minds. Still I would skip this IPO and wait for better opportunities to invest in GIC post listing, or pick better companies relatively.

Indian Energy Exchange (IEX) IPO Details & Review – Should You Invest or Not @ Rs. 1,645-1,650?

This post is written by Shiv Kukreja, who is a Certified Financial Planner and runs a financial planning firm, Ojas Capital in Delhi/NCR. He can be reached at skukreja@investitude.co.in

Indian Energy Exchange Limited (IEX), India’s largest energy trading exchange, is all set to enter the primary markets with its initial public offer (IPO) of Rs. 1,001 crore. The issue is getting opened for subscription today and will remain open for three days to close on October 11. The issue is an offer for sale (OFS) by some of its existing investors.

The company has fixed its price band in the range of Rs. 1645-1650 a share. The offer would constitute 20% of the company’s post-offer paid-up equity share capital.

Here are some of the salient features of this issue:

Size of the Issue – As mentioned above, this IPO is an offer for sale (OFS) of 60.65 lakh shares by its existing investors. This would make it a Rs. 1,001 crore IPO at the upper end of the price band of Rs. 1,650.

Price Band – IEX has fixed its IPO price band to be between Rs. 1,645-1,650 a share and the company has decided not to offer any discount to the retail investors.

No Discount for Retail Investors – The company has decided not to offer any discount to the retail investors.

Retail Allocation – 35% of the issue has been reserved for the retail individual investors (RIIs), 15% for the non-institutional investors (NIIs) and the remaining 50% shares will be allocated to the qualified institutional buyers (QIBs).

Bid Lot Size & Minimum Investment – Investors need to bid for a minimum of 9 shares in this offer and in multiples of 9 shares thereafter. So, a retail investor would be required to invest a minimum of Rs. 14,850 at the upper end of the price band and Rs. 14,805 at the lower end of the price band.

Maximum Investment – Individual investors investing up to Rs. 2 lakh are categorised as retail individual investors (RIIs). As a retail investor, you can apply for a maximum of 13 lots of 9 shares each @ Rs. 1,650 a share i.e. a maximum investment of Rs. 1,93,050. At Rs. 1,645 per share as well, you can apply only for 13 lots of 9 shares, thus making it Rs. 1,92,465.

Listing – The shares of the company will get listed on both the stock exchanges i.e. National Stock Exchange (NSE) and Bombay Stock Exchange (BSE) within 6 working days after the issue gets closed on October 11th. Its shares are expected to get listed on October 23rd.

Here are some other important dates as the issue gets closed on October 11:

Finalisation of Basis of Allotment – On or about October 17, 2017

Initiation of Refunds – On or about October 17, 2017

Credit of equity shares to investors’ demat accounts – On or about October 18, 2017

Commencement of Trading on the NSE/BSE – On or about October 23, 2017

Financials of Indian Energy Exchange (IEX)

picture1

(Note: Figures are in Rs. Crore, except per share data & percentage figures)

During financial year 2016-17, IEX reported an operating income of Rs. 203.91 crore and profit after tax (PAT) of Rs. 113.57 crore, as against Rs. 175.03 crore and Rs. 100.34 crore respectively in the previous financial year, registering a growth of 16.50% and 13.19% respectively. The company registered a degrowth in its operating income and PAT during financial year 2014-15, but made a reasonable recovery in the next couple of years post that. It has posted a CAGR of 13.89% in its operating income and 14.40% in PAT during the last 4-year period.

Though the company has shown a decline in its net profit margins during the same period, it reported a healthy 41.30% return on net worth (RoNW) in the previous financial year. However, my concern remains the same as it has been with most of the IPOs in the last 3-6 months i.e. high valuations with low margin of safety in case of a sharp decline in market sentiment. At Rs. 1,650 a share, IEX is valued at 43.81 times its FY 2016-17 diluted EPS of Rs. 37.66 and 15.78 times its net worth as on June 30, 2017.

For my investments, I am not comfortable paying such high valuations for an exchange with not so high growth in terms of revenues and profitability. At Rs. 1,650 a share, IEX will have a market cap very close to that of MCX and Bombay Stock Exchange (BSE), which again I think is unreasonable. So, considering all these factors, this IPO seems to me a high-risk high-return proposition. If the market sentiment remains buoyant as it has been with most of its recent IPOs, then this IPO too could give you a healthy listing gains. But, it could turn volatile as well in case of any adverse outcome. I would wait for a few more quarters for the euphoria to settle down somewhat and the company to implement its future course of action to augment its revenues and profitability.

Understanding Risk-Return for Various Investment Asset Classes

This blog has been contributed by our guest blogger, Ms Snehil Gupta. She is leading the marketing & business development for CrediFiable (https://credifiable.com)

Investing is putting your money at work so that it grows in value over time and generates returns for you. You should not confuse investing with savings. You save when you simply put aside a part of your income in a safe place so that it is almost risk-free such as money in your saving bank account. Your money hardly grows in value over time when you just save. On the other-hand investing is committing your money to a financial product such as mutual fund or bond or direct stock, so that your money is exposed to some amount of risk in exchange of higher expected returns.

Understanding Risk & Return on Investment

In a very layman’s definition, return on investment is the amount by which the value of your original money changes. When the sum of your invested money increases, you have positive returns and when your sum of money decreases then you have earned negative returns.

Risk is defined as probability of deviation of the actual returns from the expected returns on your invested money. What this means is that if you put your money in a risky investment then there is a chance that you may lose some or even all your initial investment. There is also a chance that your investment grows in value and you stand to gain much higher returns than the traditional risk-free financial instruments.

risk-return-infographic

There is a principle of risk-return trade-off, as per which, as the risk potential increases the likely return on investment also go-up. Thus, if you invest money in a riskier small start-up you are likely to gain higher returns in contrast to investing in relatively safer large-cap equity mutual fund. Money invested in a start-up company may grow up to 3X or even higher in value. A large-cap equity mutual fund typically gives compounded annual return of 15% – 20% over 3 – 5 years of time. But if the start-up fails, you may lose all your initial investment. Whereas money invested in a large-cap equity mutual fund will not become zero but continue to grow albeit at a slower rate even in a bear-market.

How Time Impacts Risk and Return?

Time has an important role to play in expecting return on your investment. Under the concept of Time Value of Money, a Rupee today is worth more than a rupee tomorrow.

One of the reasons behind this is the inflation which leads to decrease in the “real-value” of your money over time. If your money does not increase by an amount at least greater than inflation, then it may be better to rather spend it today. For example, say you can buy 5 apples today for Rs.100 and a year later because of inflation you need to spend Rs.105 to buy the same 5 apples. But your money has increased only to Rs.103 over one year. Now it makes more sense to use your Rs.100 to buy 5 apples today instead of less than 5 apples after a year with Rs.103.

Another reason behind decrease in the worth of money with time is the concept of opportunity cost. So, if you choose to invest money in say equity mutual fund, you are forsaking the interest you will earn on this money if kept in a bank account or as an FD.

There are two takeaways here:

  1. Whenever you invest, it is important to start early. The earlier your start, your money is worth more than what it will be later.
  2. It is essential for you to invest your money, if not then inflation will eat away all your savings. Gradually over time your money will lose its purchasing power. If you will recollect, a movie ticket was much easier on your pocket 5 years ago, than it is now.

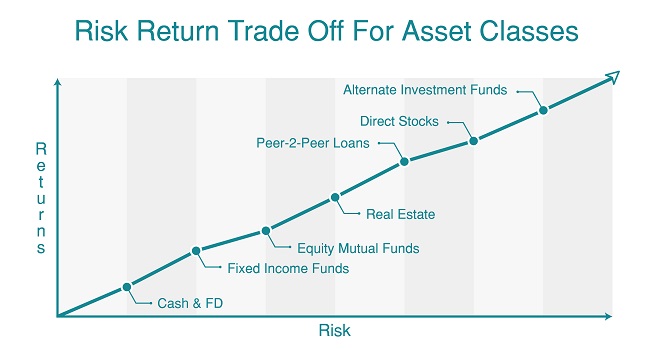
Risk-Return Trade-Off for Different Asset Classes

Asset is something which generates money. For example, if you have a house from which you generate rental income, it becomes an asset. For a business, its’ factory is an asset because it is used for the manufacturing of goods sold. Likewise, a financial instrument is an asset because it increases the value of money over time. Hence you invest your money in a financial asset. Asset class is a group of financial instruments having similar characteristics and which are subject to same regulatory guidelines.

Asset class is fundamental in financial planning. An asset class has unique risk and return characteristics. Now, depending upon an investor’s risk preference his / her financial planner may allocate different sum of money to different asset classes.

Types of Asset Classes

Mainly asset class are of 5 types with different degree of associated risk and rewards with each asset class. Let us look at the various asset classes available for you.

1. Cash

In all fairness cash is not an investment, but it is just an asset class. It is least risky but at the same time yields least returns as-well. But you must maintain an optimum amount of liquid cash either in the form of bank account savings or as a fixed income liquid mutual fund for transactions or any eventualities that may arise in future. Financial advisors suggest you to maintain 6 months’ equivalent of your expenses in form of cash or cash-equivalents.

2. Fixed Income

The most popular traditional investment vehicles in form of a Bank FD or small savings schemes offered by government are typical examples of Fixed Income asset class. A fixed income or a debt instrument is characterised with fixed repayment schedule over a fixed tenure. Of late, fixed income mutual funds which invest into corporate debt as well as government papers have started getting popular with retail investors. These carry higher risk than government schemes and offer better returns than them.

3. Equity

If you invest for a long term, then equity as an asset-class out-performs other asset classes. You can invest in equity by way of holding direct stock of companies or through the equity mutual funds. You should have sound knowledge of stock market to be able to successfully invest in direct stocks. Investing via the mutual fund route is simpler as they are managed by professional fund managers. Further, if chose to invest through the SIP mechanism you need not even worry about short volatility of the market. However, you must remember that equity is a risky asset in the short-term because of market movements. While there is a potential to gain higher return, you can also lose a lot of money without proper know-how.

4. Commodity

As Indians, we have been used to invest in gold, which is a typical commodity. Gold as an asset class has given rich dividends to its investors over long term. You can also invest and trade in other commodities such as metals, agricultural produce etc. through the commodity exchange. Commodity prices tend to have cyclical price pattern and you should equip yourself with required knowledge before investing. If you are not ready, better stay away.

If you just want to invest in gold as an asset class, then again you can take the easier route of investing through the Sovereign Gold Bond scheme as launched by Government of India or the Gold ETFs.

5. Real Estate

For long investor, have flocked to real estate as an asset class. You can invest either in commercial or residential real estate or a land parcel depending on the sum you want to invest. In the long run, real estate helps you multiply your investment but there are a few challenges associated with buying real estate. Clear titles, transaction cost and transparency are major hindrances you will face when buying. Even at the time of selling you would bear higher transaction cost than financial products. Moreover, you cannot sell your real estate investment in parts or even if you want to sell-off the entire asset then finding the right buyer at right price point may become a challenge. Real estate investment therefore, tend to be least liquid as compared to the others.

The Alternate Investment Asset Class

In addition to the above-mentioned traditional asset classes, you also have the option to diversify your portfolio with Alternate Investment Asset Classes. Let us look at few of the prominent Alternate Investment Asset Class in India.

The Alternate Investment Fund (AIF)

If you are an HNI (High Net Worth Individual) investor, you have the option to invest via Alternate Investment Funds (AIFs). These are privately pooled funds formed under the structure of trust permitting you to invest in higher risk bearing financial structures to earn superior returns. These funds have a dedicated fund manager to manage the pooled money and are typically closed ended funds. Through the AIFs you get a chance to invest start-ups, early-stage ventures, infrastructure or social ventures even if you don’t have professional knowledge of any of these sectors.

The Collectibles

Collectibles such as works of art, vintage cars, stamp collection and even race horses are another set of alternate asset class. Yet again, these are within the reach of ultra HNI and wealthy investors. One drawback of collectibles is that their market is not yet fully developed in India and is still illiquid. What this means is that while you may invest money in any of the collectibles, but it may not be possible to sell it for the right value at your desired time of sale. This is because there may be limited number of total buyers for such items and finding the right buyer at the time you want may not always be possible.

Game-Changer in Alternate Investment – P2P Loans

So far, alternate investment vehicles were meant only for the wealthy and affluent. With technology changing the entire financial services landscape, a new and genuine alternate investment asset class has come-up in the form of P2P loans. This asset class is within the reach of an average investor. You need not bring in millions of rupees to start investing in P2P loans.

P2P or Peer-to-Peer loans are online market places where an individual can borrow directly from another individual. When you become a lender on a P2P platform, you are investing your money which comes back to you every month with interest as EMI. You can earn anywhere between 14% – 25% depending on who you wish to lend money to. P2P loans are in-between debt and equity in terms of risk-reward metric. They have the characteristic fixed repayment schedule like a debt instrument but the risk associated with them is higher. Plus, you can diversify the risk by lending smaller amount to higher number of people. The distribution helps in limiting the default risk on the loan.

But you must note that the RBI regulations still do not cover the P2P loans. RBI has finalised its regulations but not yet brought them out. It had also published a consultation paper on P2P loans in 2016. Hence, before investing, you are advised to be aware about the risks associated with P2P business model.

You must choose your asset class keeping in mind your risk appetite. It is also advisable to consult a financial planner to assess your goals, investment horizon and then chalk out your investment strategy.

Godrej Agrovet Limited IPO Details & Review – Should You Invest or Not @ Rs. 450-460?

This post is written by Shiv Kukreja, who is a Certified Financial Planner and runs a financial planning firm, Ojas Capital in Delhi/NCR. He can be reached at skukreja@investitude.co.in

Godrej Agrovet Limited, a 62.61% subsidiary of Godrej Industries, is all set to get listed on the stock exchanges with its initial public offer (IPO) of Rs. 1,157 crore getting opened for subscription today onwards. The IPO is a mix of fresh issue of equity shares and an offer for sale (OFS) by its promoter Godrej Industries and existing shareholder Temasek.

As always, the issue will remain open for 3 working days to close on October 6. The company has fixed its price band in the range of Rs. 450-460 a share. The offer would constitute up to 13.13% of the company’s post-offer paid-up equity share capital.

Here are some of the other salient features of this issue:

Size & Objective of the Issue – As mentioned above as well, this IPO is a combination of an offer for sale (OFS) by its promoter Godrej Industries and Temasek, and a fresh issue of shares worth approximately Rs. 292 crore. This would make it a Rs. 1,157 crore IPO at the upper end of the price band.

The company will use the money raised to repay its debt obligations availed for working capital purposes, repay its commercial paper investors and for other general corporate purposes.

Price Band – Godrej Agrovet has fixed its price band to be between Rs. 450-460 a share and the company has decided not to offer any discount to the retail investors.

No Discount for Retail Investors or Employees – The company has decided not to offer any discount to the retail investors or its employees.

Retail Allocation – 35% of the issue has been reserved for the retail individual investors (RIIs), 15% for the non-institutional investors (NIIs) and the remaining 50% shares will be allocated to the qualified institutional buyers (QIBs).

Reservation for Employees – The company has decided to keep its shares worth Rs. 20 crore reserved exclusively for its employees.

Bid Lot Size & Minimum Investment – Investors need to bid for a minimum of 32 shares and in multiples of 32 shares thereafter. So, a retail investor would be required to invest a minimum of Rs. 14,720 at the upper end of the price band and Rs. 14,400 at the lower end of the price band.

Maximum Investment – Individual investors investing up to Rs. 2 lakh are categorised as retail individual investors (RIIs). As a retail investor, you can apply for a maximum of 13 lots of 32 shares each @ Rs. 460 a share i.e. a maximum investment of Rs. 1,91,360. At Rs. 450 per share also, you can apply only for 13 lots of 32 shares, thus making it Rs. 1,87,200.

Listing – The shares of the company will get listed on both the stock exchanges i.e. National Stock Exchange (NSE) and Bombay Stock Exchange (BSE) within 6 working days after the issue gets closed on October 6th. Its shares are expected to get listed on October 16th.

Here are some other important dates as the issue gets closed on October 6:

Finalisation of Basis of Allotment – On or about October 12, 2017

Initiation of Refunds – On or about October 13, 2017

Credit of equity shares to investors’ demat accounts – On or about October 13, 2017

Commencement of Trading on the NSE/BSE – On or about October 16, 2017

Financials of Godrej Agrovet Limited IPO

picture1

(Note: Figures are in Rs. Crore, except per share data & percentage figures)

During the financial year 2016-17, Godrej Agrovet reported a total income of Rs. 4,983.45 crore and profit after tax (PAT) of Rs. 274.39 crore as against Rs. 3,817.67 crore and Rs. 261.09 crore in the previous financial year, thus generating a net profit margin of 5.51% in 2016-17 vs. 6.84% in the previous year. At Rs. 460 a share, the company is valued at 38 times its reported diluted EPS of Rs. 12.03 for the financial year 2016-17 and 29-30 times its estimated annualised EPS of Rs. 15.52.

Despite a decent growth in its topline, the company has not been able to improve on its profit margins. In fact, its profit margins have fallen from 6.84% in FY 2015-16 to 5.51% during FY 2016-17 and 5.42% during the first quarter of the current financial year. Moreover, at Rs. 460 a share, it is valued at a price to book value of 8 times based on its net worth of Rs. 57.94 a share as on June 30, 2017.

I think these valuations are on a higher side for me to invest in it as there is very little scope of any significant capital appreciation in the short to medium term. I think it will require the company to deliver a consistent improvement in its financial performance in order to justify such high valuations. I would avoid investing in this IPO at this juncture and wait for it to correct 20-30% to get fairly valued and justify its valuations for the long term investment.

SBI Life Insurance IPO Review – Should You Invest or Not @ Rs. 685-700?

This post is written by Shiv Kukreja, who is a Certified Financial Planner and runs a financial planning firm, Ojas Capital in Delhi/NCR. He can be reached at skukreja@investitude.co.in

SBI Life Insurance IPO Details

I covered the details of SBI Life Insurance IPO in my previous post yesterday. In this post, I have tried to cover its fundamental factors based on which we decide whether we should invest in this IPO or not. So, please go through these factors before taking a final decision.

Peer Comparison of Top 5 Private Life Insurance Companies

picture1

Financials of SBI Life Insurance Company Limited

picture2

(Note: Figures are in Rs. Crore, except per share data & percentage figures)

Comparing SBI Life’s fundamentals with that of its rival companies in the industry, there are many factors which augur well for SBI Life over its peer companies. In the previous 2-3 years, SBI Life has been the fastest growing private life insurance company among the top five private insurance companies listed in the table above. It has grown at a CAGR of 35.47% since FY15 as against HDFC Life’s 25.82% and ICICI Prudential’s 21.42%.

Moreover, its operating expense ratio at 7.83% has also been the lowest among the top 5 private life insurance companies listed in the table above. ICICI Prudential’s operating expense ratio comes next at 10.54% and HDFC Life’s expense ratio stands at 12.27%.

But, the question is why everything looks rosier when there is an IPO just around the corner and why it falters quickly after the money gets raised at high valuations?

ICICI Life Insurance came out with its IPO exactly one year from today and successfully raised Rs. 6,057 crore from the investors. Its Indian Embedded Value (IEV) on March 31, 2016 was Rs. 13,939 crore and at Rs. 334 a share at the time of its IPO, the company was valued at Rs. 47,957 crore. That made the company to be valued at 3.44 times its embedded value.

Now, as the SBI Life has come out with its IPO, its own Indian Embedded Value (IEV) has been calculated as Rs. 16,538 crore as on March 31, 2017. At Rs. 700 a share, the insurance company would be valued at Rs. 70,000 crore, which translates it to be 4.23 times its embedded value.

At 3.44 times, ICICI Life IPO looked expensive to me one year back, and even after one year of it getting listed on the bourses, currently it is trading at 3.8 times its embedded value. I still have a view that ICICI Life is trading at expensive valuations. So, if ICICI Life at 3.8 times its embedded value is trading at expensive valuations, then I think SBI Life is more expensive at 4.23 times its embedded value.

SBI Life reported Rs. 954.65 crore in profits, Rs. 9.55 a share as EPS and Rs. 55.52 as book value per share during the previous financial year i.e. FY 2016-17. At its likely issue price of Rs. 700 a share, the company is valued at 73.3 times its 12-months trailing EPS and 12.61 times its book value as on March 31, 2017. Despite of its rapid growth in the previous few years, these are highly stretched valuations the company is seeking from its prospective investors.

Like ICICI Lombard, SBI Life too is seeking a hefty premium of more than 50% over its last transaction of share sale in less than a year’s time. On December 9, 2016, SBI Life’s parent company, State Bank of India (SBI) entered into an agreement with Temasek Holdings and KKR Asian Fund to sell its 3.90% stake in the company for Rs. 460 a share. Now, just 9 months after that stake sale, its promoters are seeking a steep premium of 52% from its new investors, including the common investors like you and me.

Again, I think it is highly unreasonable to seek such a steep premium in such a short period of time. Even if the company succeeds in carrying out this IPO at Rs. 700 a share, I don’t think this investment could be a multibagger for its investors. I think it should list at a maximum of 10% premium to its issue price and a profit booking could drag its price below the issue price post listing.

So, at these valuations, I would avoid this IPO personally and advise my clients as well to do so.